
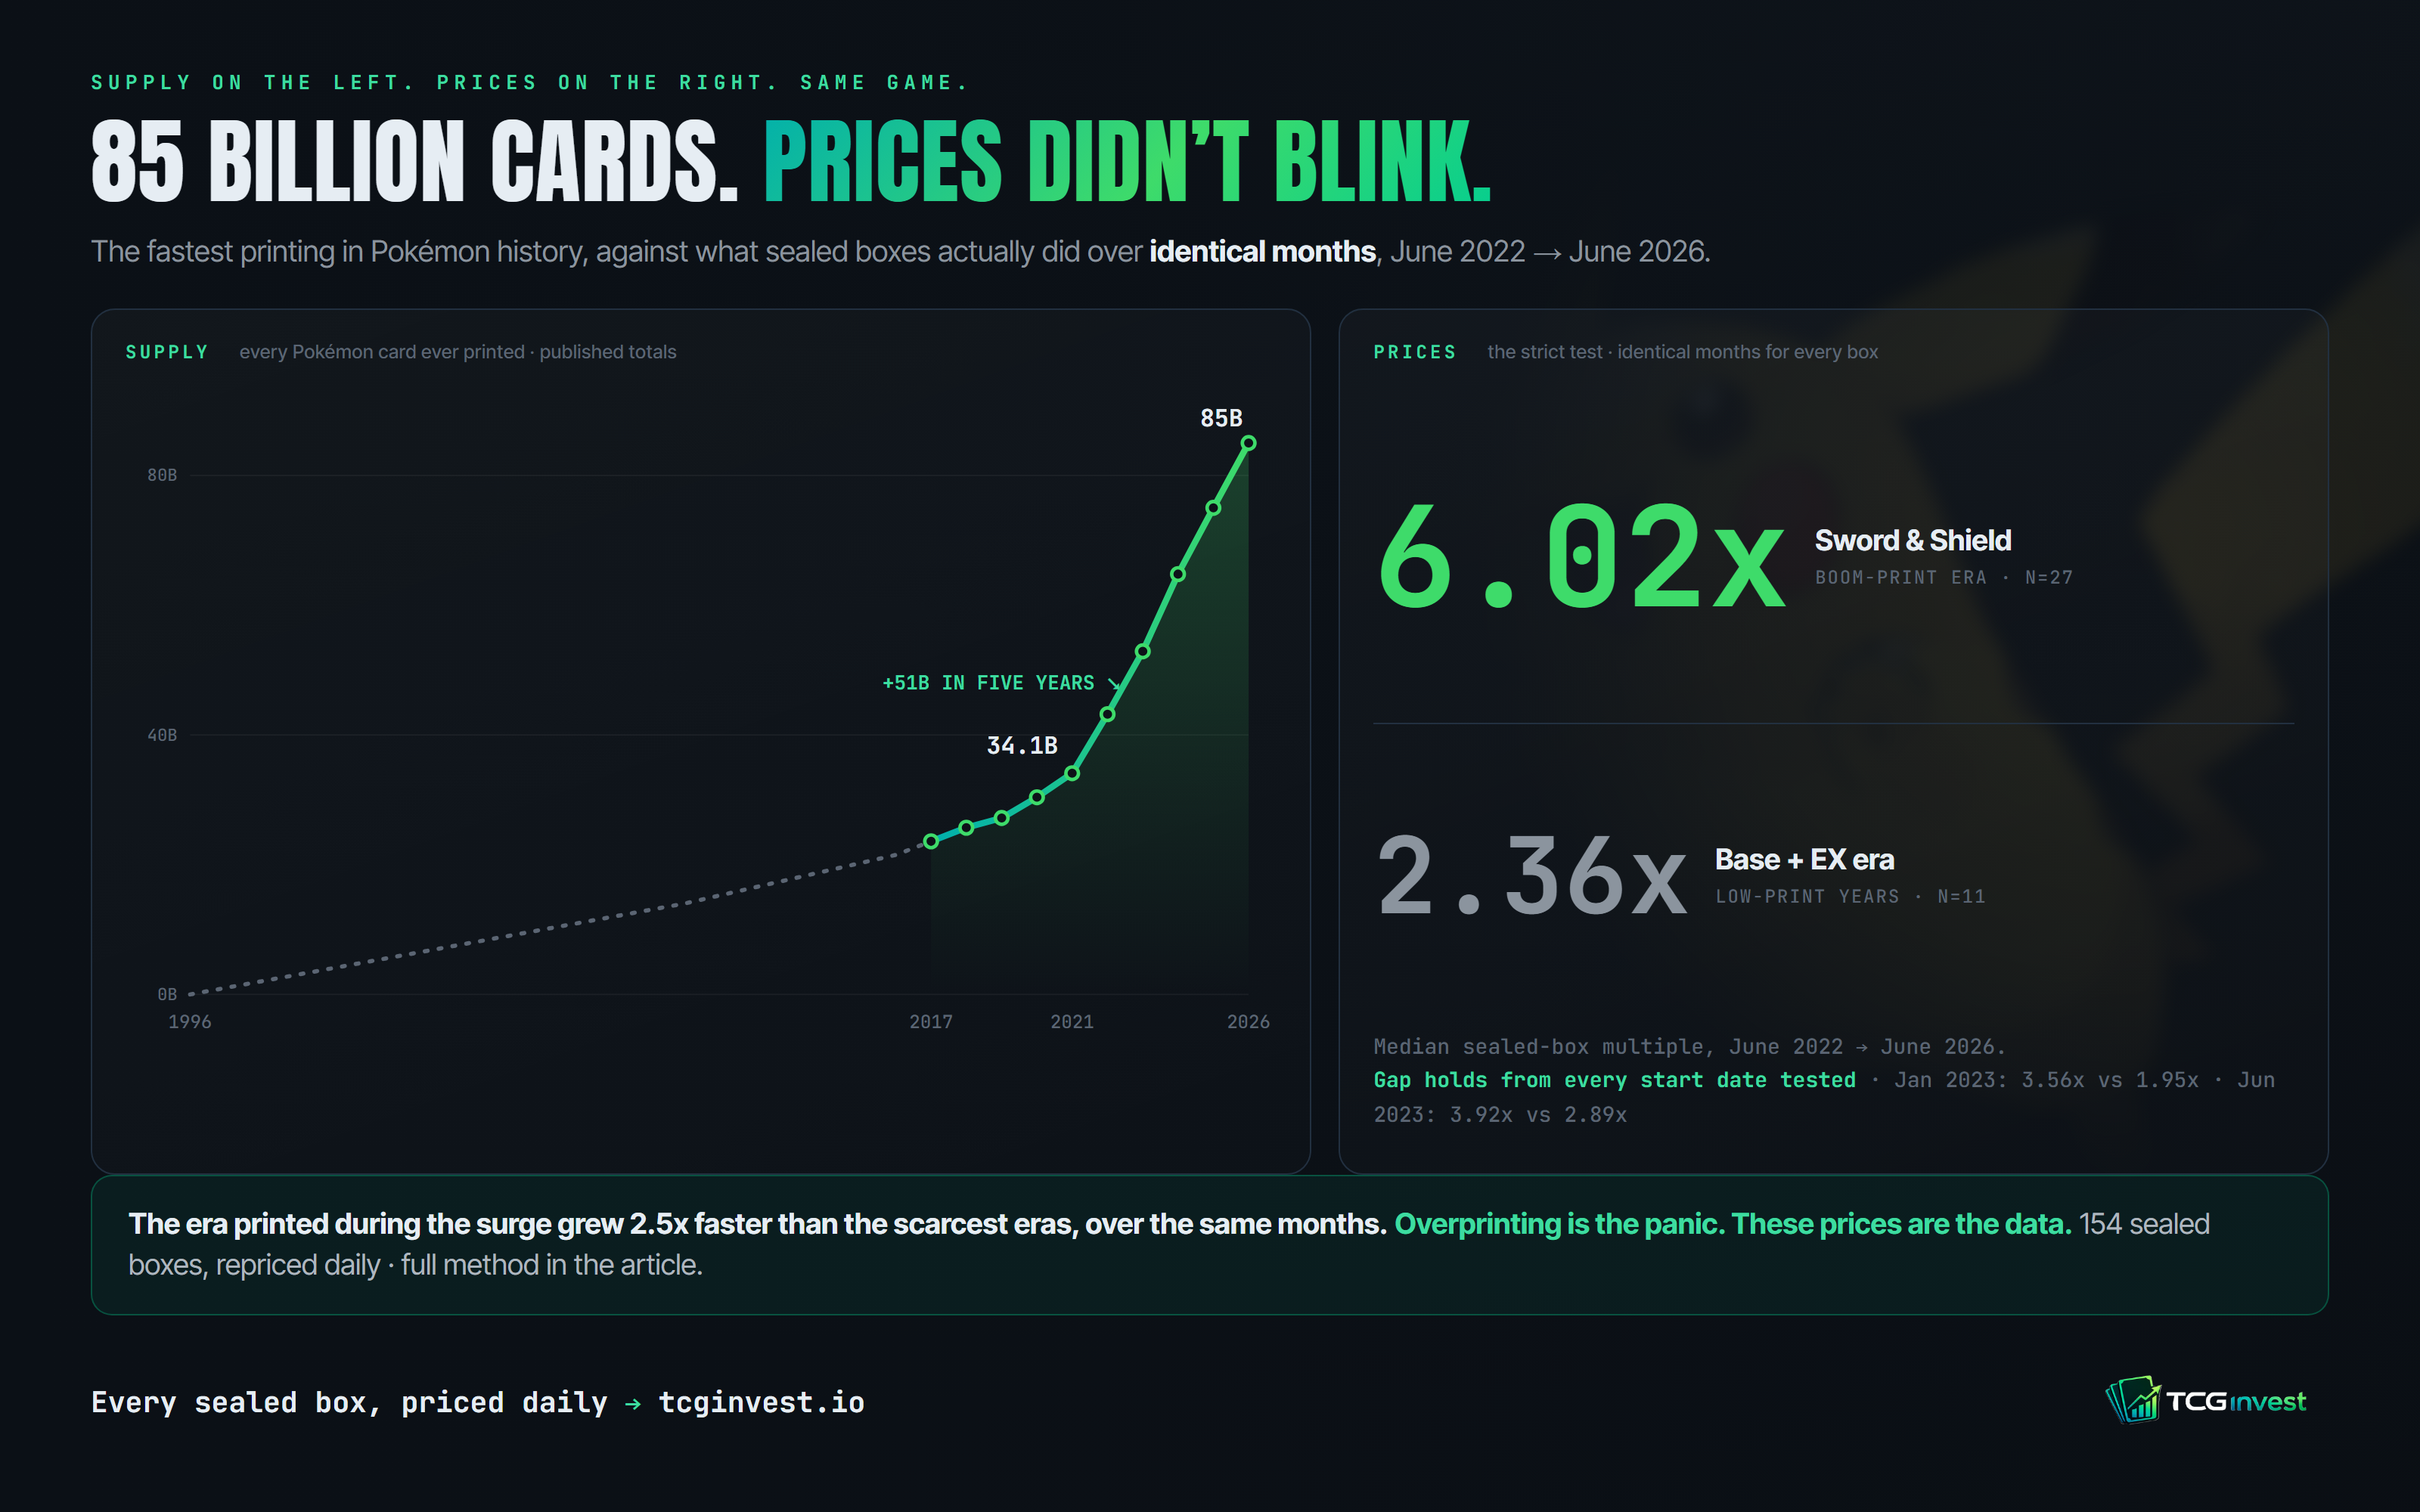
It took Pokémon 25 years to print its first 34 billion cards. The five years since added 51 billion more — 60% of every Pokémon card that has ever existed, made in the last five years. Roughly 10 billion of them landed in the twelve months to March 2026 alone, and The Pokémon Company says it is printing at maximum capacity. Its main printing partner is building a 1.27 million square foot campus in North Carolina, with full-scale operations expected in late 2028.
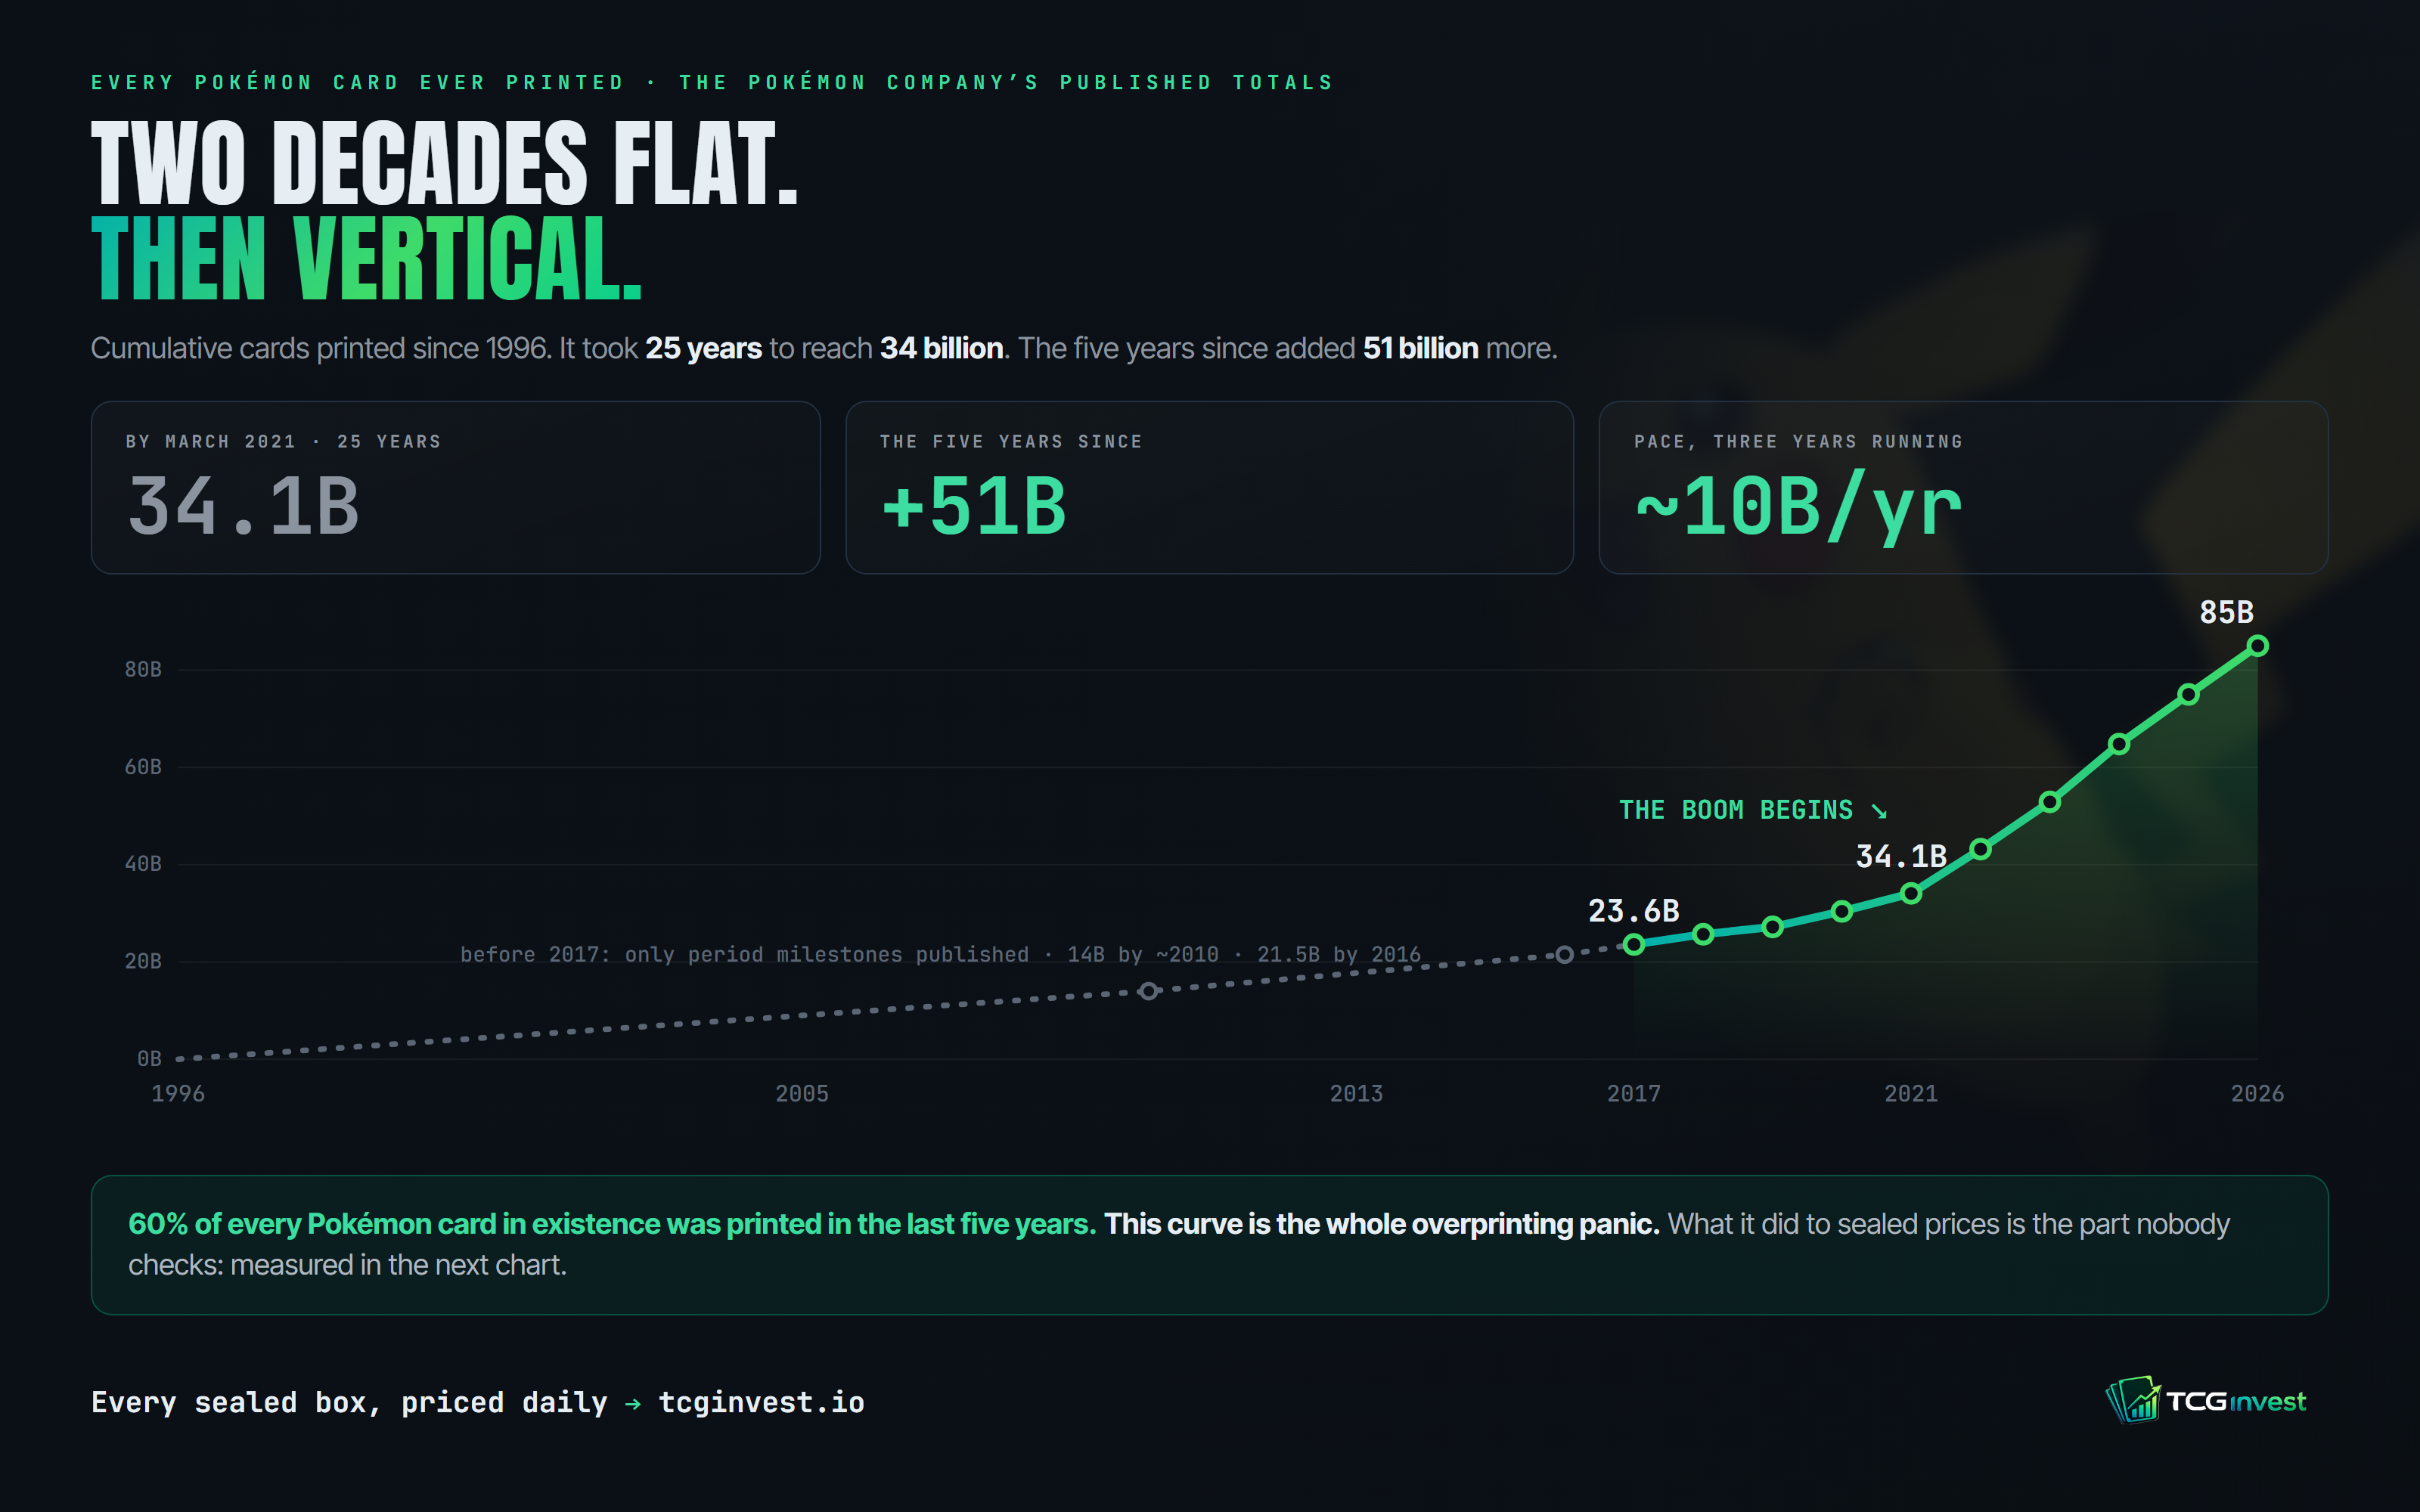
Collectors have seen a curve like this before, and it ended badly.
Through the late 1980s and early 1990s, the baseball card industry ran its own printing boom. Production figures were never officially published, but hobby historians estimate Topps alone was printing over a billion cards a year by the mid-1980s, and that sets like 1991 Donruss ran into the billions of cards — the estimates vary widely precisely because the runs were so enormous that nobody was counting. New sets arrived constantly, and the flagship runs were printed in the millions per card.
Then demand collapsed. A late-80s common is functionally worthless today, and many sealed boxes from that period still sell for less than they cost at retail 35 years ago. Collectors call it the junk wax era, and it is the reason experienced buyers look at Pokémon's printing curve and reach for the same word.
The parallel is worth taking seriously. So we tested it the only way prices can test it: against our own database.
What we measured
Our database holds monthly sealed prices — the monthly median of TCGplayer market prices — from May 2021 to June 2026, for products spanning every era of the game. We took every booster box and elite trainer box with at least 24 months of tracked history and a starting price of $20 or more: 154 products. The $20 floor is a data-quality filter; we validated the sub-$20 records for sealed boxes and they are bad data, not real prices.
Two honest complications, both handled in the open. First, a product's earliest tracked month is sometimes a pre-release or thin-listing spike rather than a market price — 13 of the 154 enter the data that way (a Twilight Masquerade Pokémon Center ETB shows $556 in its pre-release month and $58 at retail a month later). So the entry price is the lower of each product's first two tracked months. Without that rule the all-product median is 4.06x; with it, 4.28x — the finding does not depend on it, but the individual product stories do.
Second, not every product is tracked over the same dates — a 2024 box cannot have a 2021 price. So we ran the comparison two ways: each product over its own full tracked window, and a strict head-to-head where every product is measured over the exact same months. Both are below, and the pricing method is documented in full.
The scoreboard by era
However we cut it, sealed boxes from the boom-print years outgrew sealed boxes from the scarce vintage years.
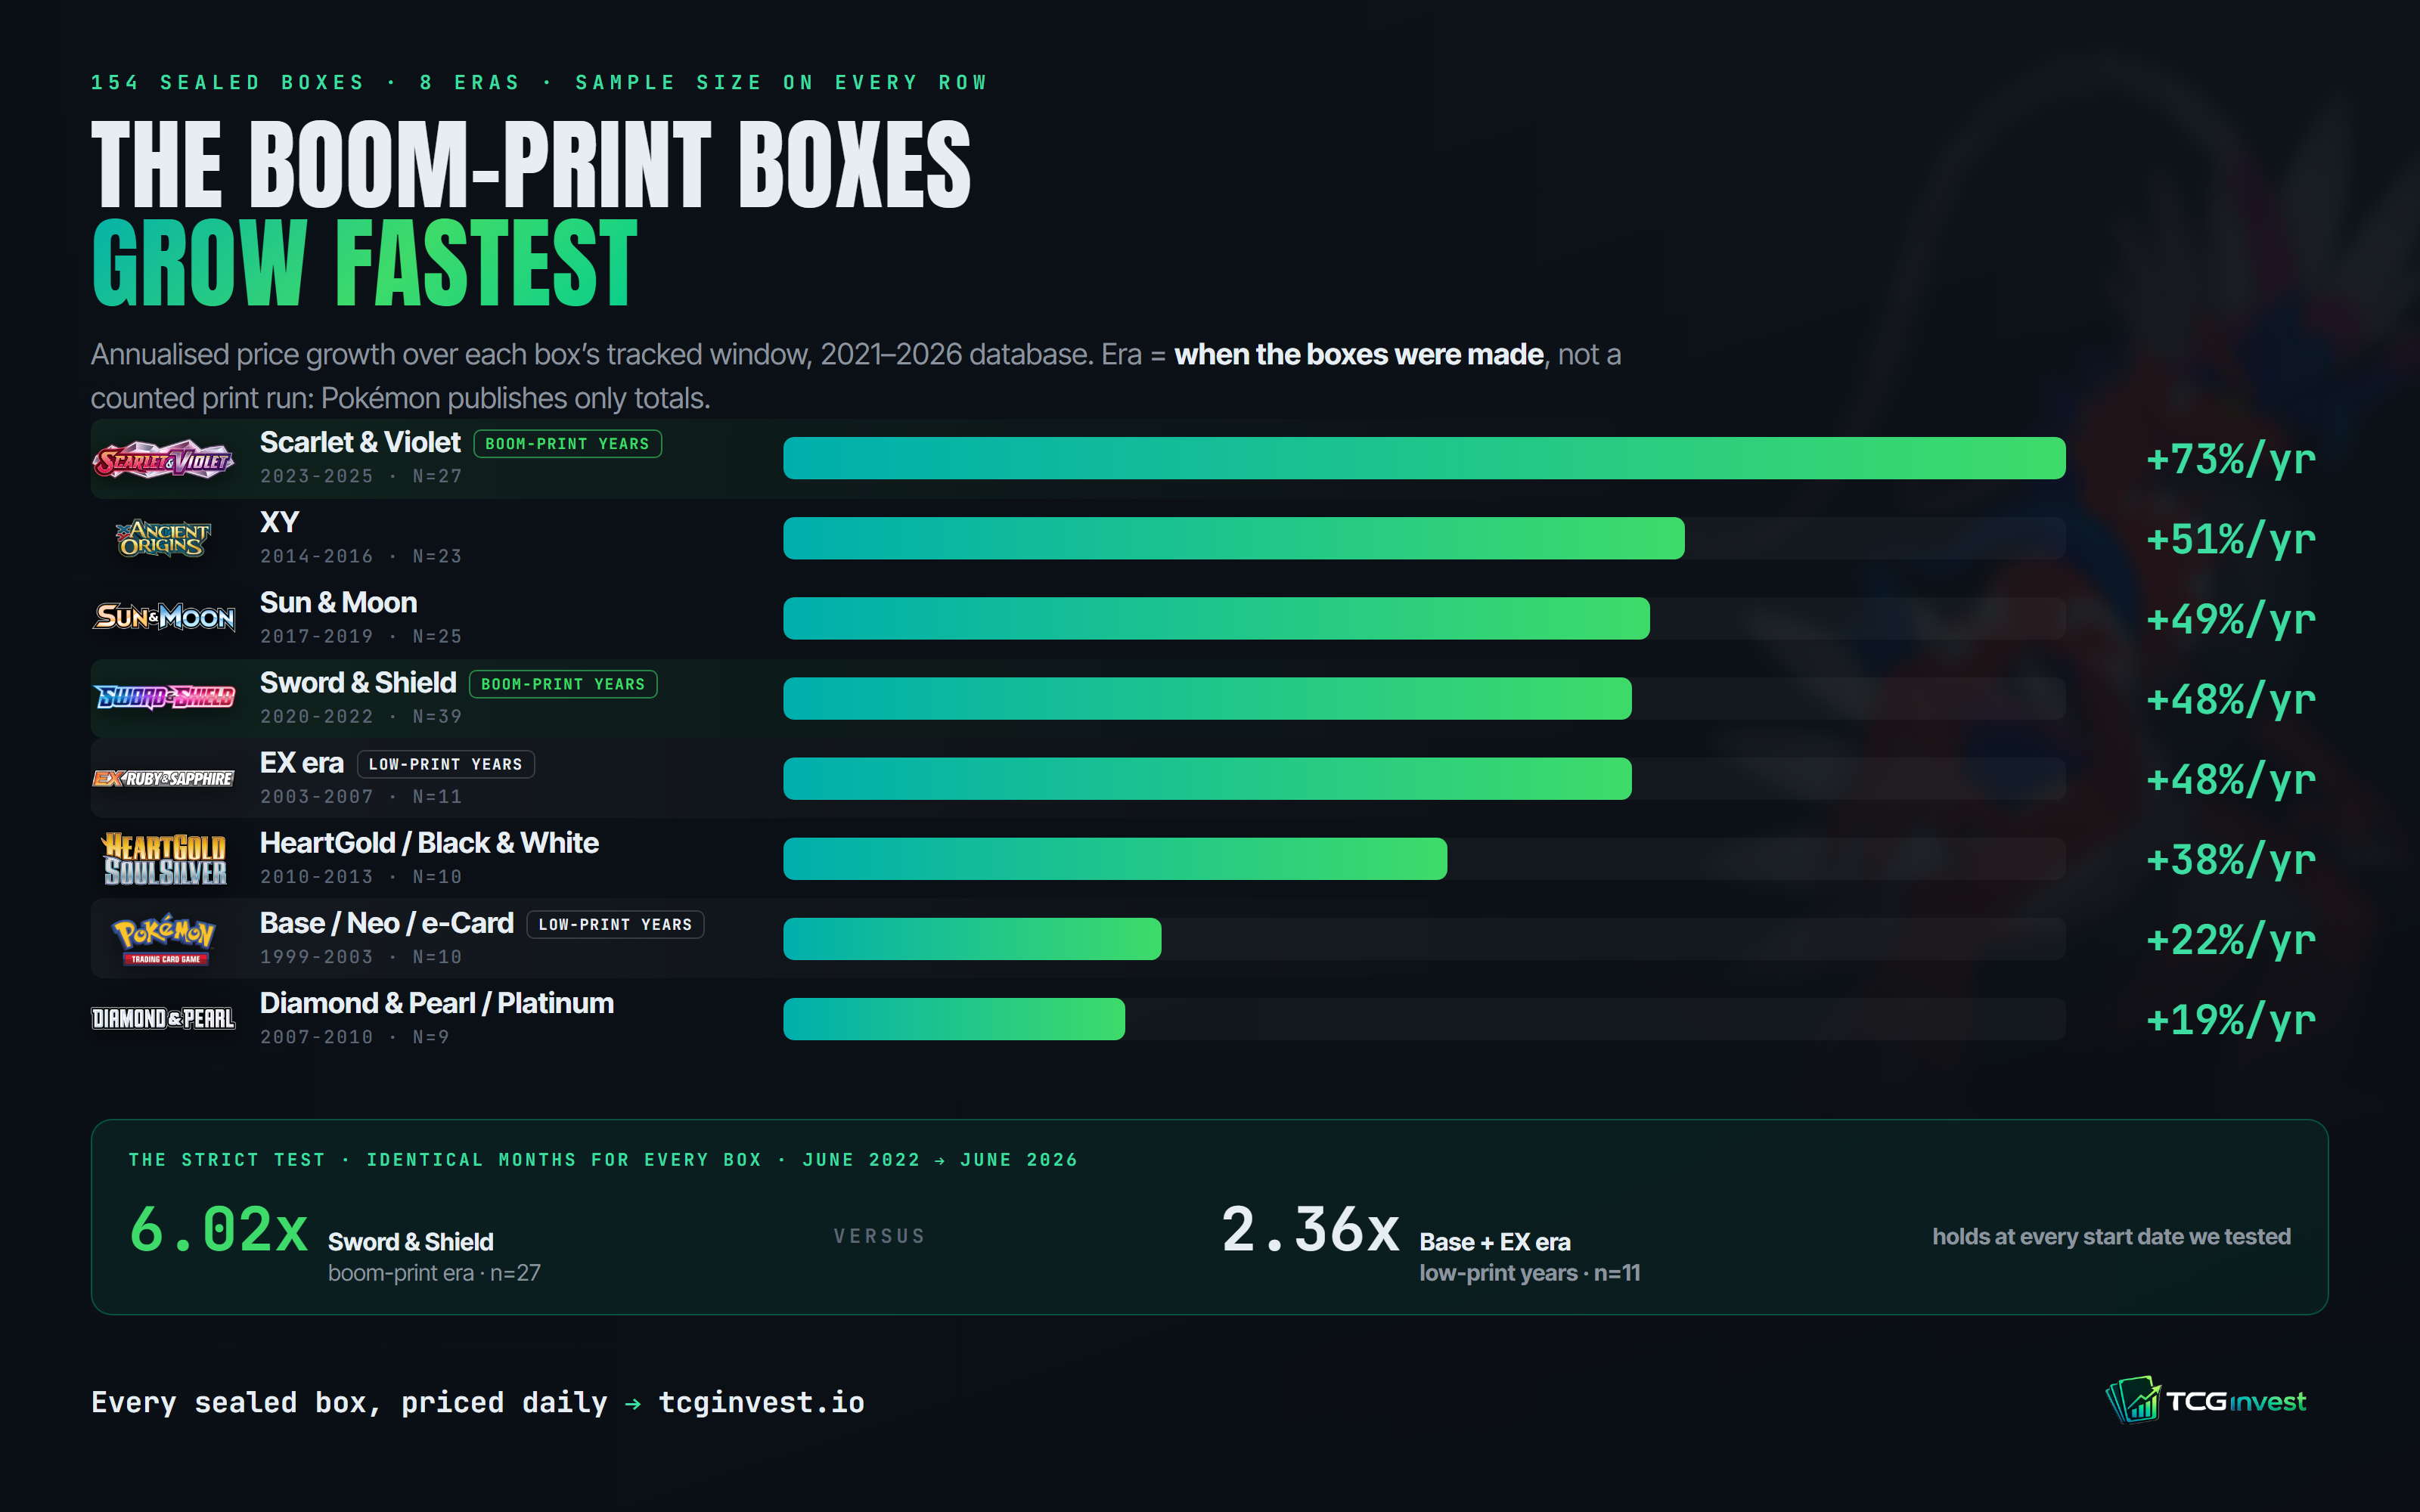
The strict test first, because it is the one a skeptic should ask for. Take only the products tracked continuously from June 2022 to June 2026 — identical months for every box, immune to the entry-price question entirely. The Sword & Shield era, manufactured during the biggest production surge in the game's history, returned a median 6.02x (27 products). The Base, Neo, e-Card and EX eras — printed in the game's low-output years, when the lifetime total had only reached about 14 billion cards by 2010 — returned 2.36x (11 products). Rerun from January 2023, the gap is 3.56x against 1.95x; from June 2023, 3.92x against 2.89x. It survives every start date we tested.
The wider view uses each product's full tracked window, annualised so different window lengths can sit in one table. Scarlet & Violet — printed during the 10-billion-a-year period itself — is growing fastest of all eight eras at a median 73% per year, with every one of its 27 tracked boxes above its entry price. The two weakest eras in the table, Diamond & Pearl/Platinum (19%/yr) and Base/Neo/e-Card (22%/yr), are both from the low-volume 2000s. The middle of the table is a near-tie — Sun & Moon, Sword & Shield and EX era all sit within a point of 48%/yr — which is what you would expect if print volume were not the variable driving the ordering.
Across all 154 products, the median box multiplied 4.28x over its tracked window and 97% finished higher than they started.
Two things this table is not. It is not a measure of print runs: Pokémon publishes aggregate totals, not per-set quantities, so "boom-print era" describes when a product was manufactured, not a counted supply figure. And a price multiple is not a realised return — nobody pays you the database price minus nothing; fees, shipping and spread all exist. What the table does show is simple: five years of the heaviest printing in the game's history, and the boxes printed during it sit at the top of the growth table, not the bottom.
Why the junk wax comparison keeps failing
The junk wax collapse was not caused by printing a lot in one year. It was caused by enormous production meeting a speculative demand collapse, with print runs so large that the surviving supply still dwarfs collector demand three decades later. The cards were printed in the millions per card, and the buyers left.
Pokémon's structure is different in one specific way: sets stop being printed. Current products get reprinted while in production — Pokémon says so itself — but once a set is retired it is not replenished. Ancient Origins boosters have not been manufactured since the set's production run ended in the 2010s, and its sealed supply has only one direction to go, because every box that gets opened leaves the sealed pool permanently.
So there are two separate supplies behaving in opposite directions:
- Current sets: supply is being actively created, as fast as the presses allow. Empty shelves are a demand statement, not a scarcity statement.
- Retired sets: supply is fixed and shrinks every time someone opens a box.
The 10 billion cards printed last year are overwhelmingly new supply for products in print today. They do not directly add a single box to the sealed pool of retired sets — which is where the growth in the table above has historically accumulated.
There is also a boring explanation sitting underneath all of this, and it deserves saying plainly: demand grew faster than supply. Ten billion cards a year and still empty shelves is a statement about how many people want the product. Our data cannot separate "printing does not hurt" from "demand outran everything" — and it does not need to. The claim under test was that print volume itself predicts price damage. In five years of prices, it has not. And when demand did crack, in 2021, we measured that too: what recovered from the last Pokémon bubble is its own study, and print era was the strongest predictor there as well.
The boxes that actually lost money
Out of 154 tracked boxes, exactly four are below their entry price. All four are five-figure or near-five-figure vintage boxes:
| Product | Era | From | To | Multiple |
|---|---|---|---|---|
| Emerald Booster Box | EX era · 2005 | $26,500 | $14,054 | 0.53x |
| Majestic Dawn Booster Box | Diamond & Pearl · 2008 | $9,999 | $5,900 | 0.59x |
| Crystal Guardians Booster Box | EX era · 2006 | $29,751 | $27,606 | 0.93x |
| Holon Phantoms Booster Box | EX era · 2006 | $22,000 | $20,431 | 0.93x |
Notice what is missing: there is no modern box on the list. The losses live at the scarce end of the market, where a box costs as much as a car, the buyer pool is tiny, and the quoted price moves on the mood of very few participants. We flag that openly — for boxes this thin, the multiple measures the market's mood swing more than a realisable exit — but that cuts both ways: these are also the only four losses in the study, and thin markets are exactly where scarcity is supposed to be strongest.
The modern losses people expect to find are there, but they live somewhere specific: the pre-release window. Thirteen products entered our data at spike prices — pre-order and launch-frenzy months — and were 40 to 90 percent cheaper within a month or two at retail. The Twilight Masquerade Pokémon Center ETB listed at $556 pre-release, hit $58 at retail, and has since climbed to $186: a disaster if you pre-ordered at hype, a triple if you bought it on shelves. Pre-release prices were the one reliably bad entry in the entire dataset.
What this actually means
If you are worried about Pokémon sealed product, five years of prices have not located the risk in the size of the print run. The dangers that actually showed up are:
- Buying at pre-release hype. The only consistent modern losses in the data are measured from pre-order-window prices. The same box a month later, at retail, was the best-performing asset class in our database.
- Buying into a market so thin the price is theoretical. All four outright losers are five-figure vintage boxes.
- Opening the box — which converts a fixed-supply item back into singles. Our raw vs graded vs sealed study measures that format gap directly, and the five-year test against the S&P 500 shows where sealed and opened product diverged.
And one honest limit on all of it: this is what has happened through June 2026. The new printing campus reaches full scale around 2028, and no price database can tell you what an even larger supply meets in demand two years from now. What the record does show is that the last five years — the fastest printing in the game's history — were also, era for era, some of its best sealed returns.
Ten billion cards a year is genuinely a lot. So far, it has not been the thing that decides what a sealed box is worth once its print run ends.
Every era in the table above is repriced daily. When the engine flags a card trading below its own recent level, it posts to our public deal signals ledger, entry by entry with outcomes on the record, and to a free Telegram channel the moment it fires. If you want to watch the boom-print thesis play out from here, browse the sets and track the boxes yourself.
Methodology: monthly medians of TCGplayer market prices, May 2021 to June 2026. Included: booster boxes and elite trainer boxes with 24+ months of tracked history and a $20+ first price (a data-quality floor; validated sub-$20 sealed records were data errors) — 154 products, equal-weighted, so medians describe the typical qualifying box, not the typical dollar. Entry price = the lower of each product's first two tracked months, which strips pre-release listing spikes (13 of 154 affected; without the rule the all-product median is 4.06x and 95.5% positive). Full-window multiples run from entry to latest tracked month; window lengths differ, and the annualised table normalises duration but not calendar regime — annualised growth is computed per product, then the era median is taken. The strict same-window test uses only products tracked continuously June 2022 → June 2026, with the June 2022 price as entry for every box; the vintage cohort groups the pre-2008 low-output eras (Base through EX) for sample size, a grouping fixed before the test. Price multiples exclude fees, shipping and spread. Print figures are The Pokémon Company's published aggregate totals (fiscal-year endpoints, a separate series from our price window); per-set print runs are not published, and era labels describe when products were manufactured, not counted print quantities. Eras follow the TCG's own series boundaries.