
Every collector has heard some version of the same story. A booster box left in a cupboard. A card a parent threw out. For a decade now Pokémon has been described as one of the best things you could have bought, the way Bitcoin was described before it, and sneakers and watches after.
The stories are always about one item. Nobody ever says what happened to the rest of them.
In July we measured those categories against each other, raw singles against PSA 10 slabs against sealed product. This is the other half of the question. Beating each other is one thing. Here is how all three did against the stock market.
So we looked at the rest of them. Five years of prices, 8,881 single cards and 90 sealed products, all from the same source, next to the S&P 500 over the same days.
The sealed boxes did not just win. They won without the losers.
Sealed, singles and the index: the five-year scoreboard
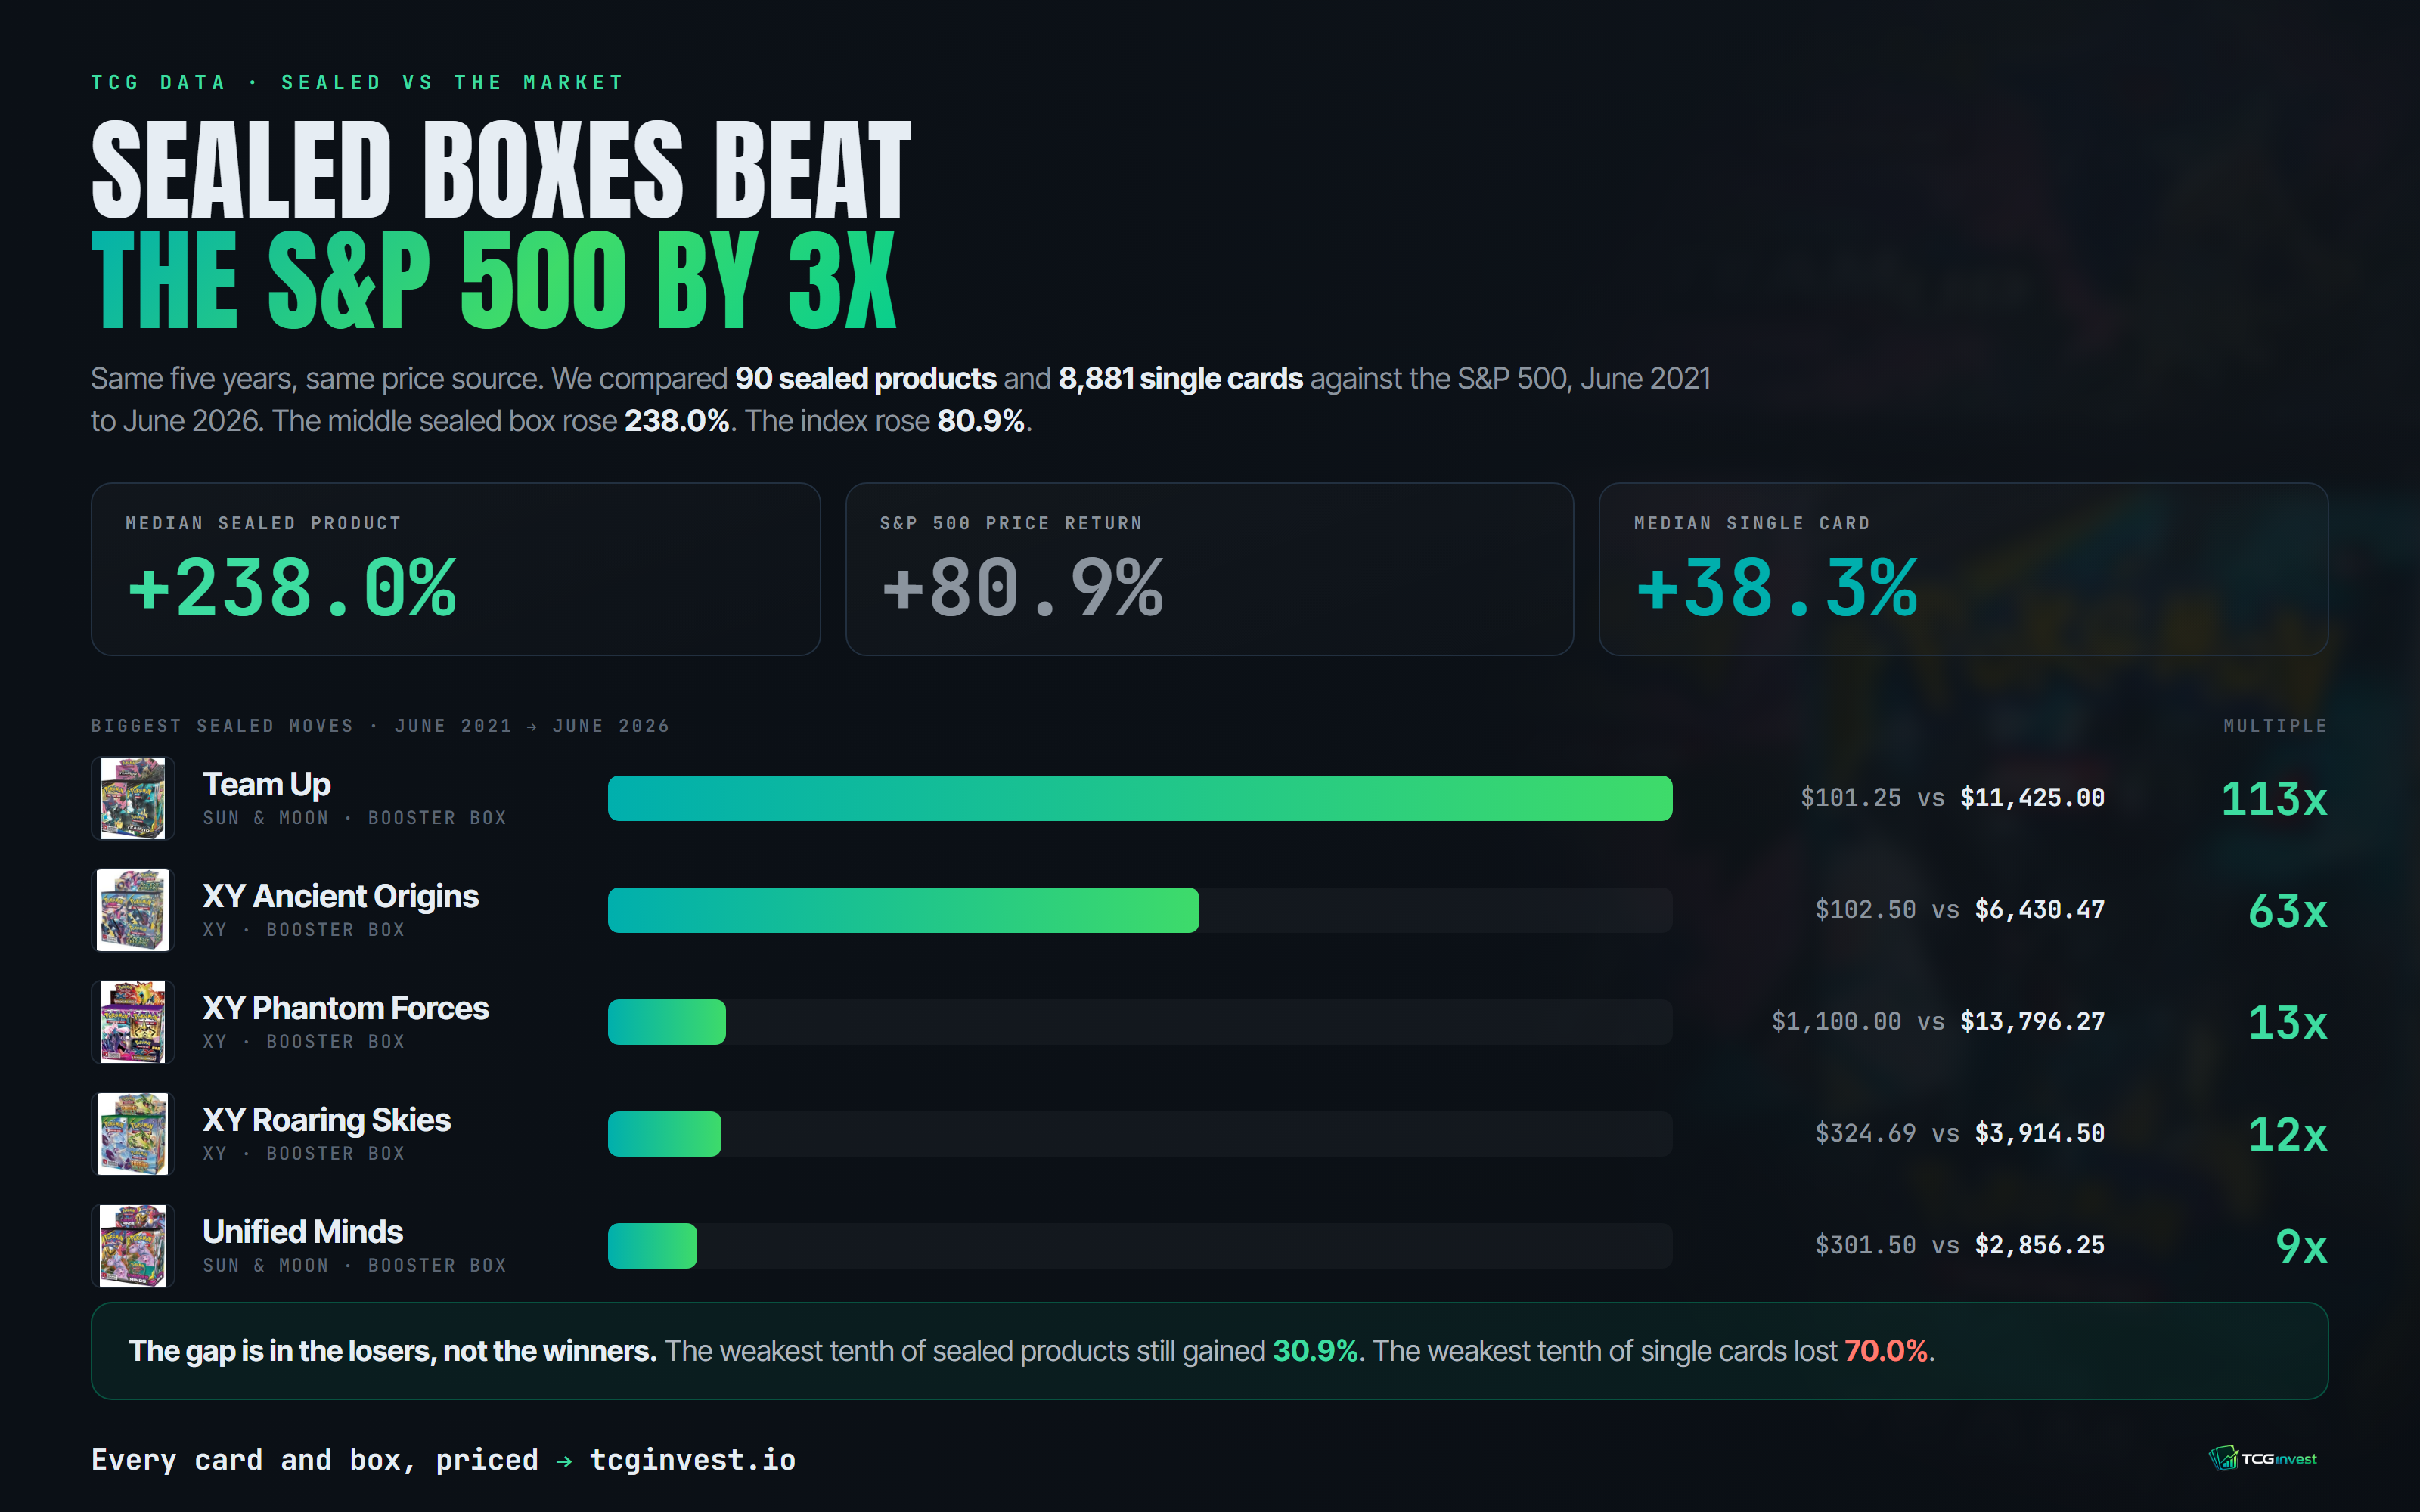
From 1 June 2021 to 1 June 2026, the median sealed Pokémon product rose 238.0%, compared with 38.3% for a raw near-mint single card and 80.9% for the S&P 500.
The difference is large.
Across 90 sealed products, the median price rose 238.0%. The basket total rose 214.6%. And 94.4% of the sealed products went up.
The weakest tenth still gained 30.9%.
Single cards were much more mixed. Across 8,881 raw near-mint cards, the median rose 38.3%. 62.3% went up.
The weakest tenth fell 70.0%.
At the other end, the strongest tenth of single cards rose 333.1%. The strongest tenth of sealed products rose 1,660.6%.
That is the part that stands out. The difference was not simply that sealed products had a higher middle result. The spread between the weakest and strongest products was also very different.
For sealed products, even the weakest tenth remained positive over these five years.
For single cards, the weakest tenth lost 70.0%.
Do Pokémon cards beat the S&P 500?
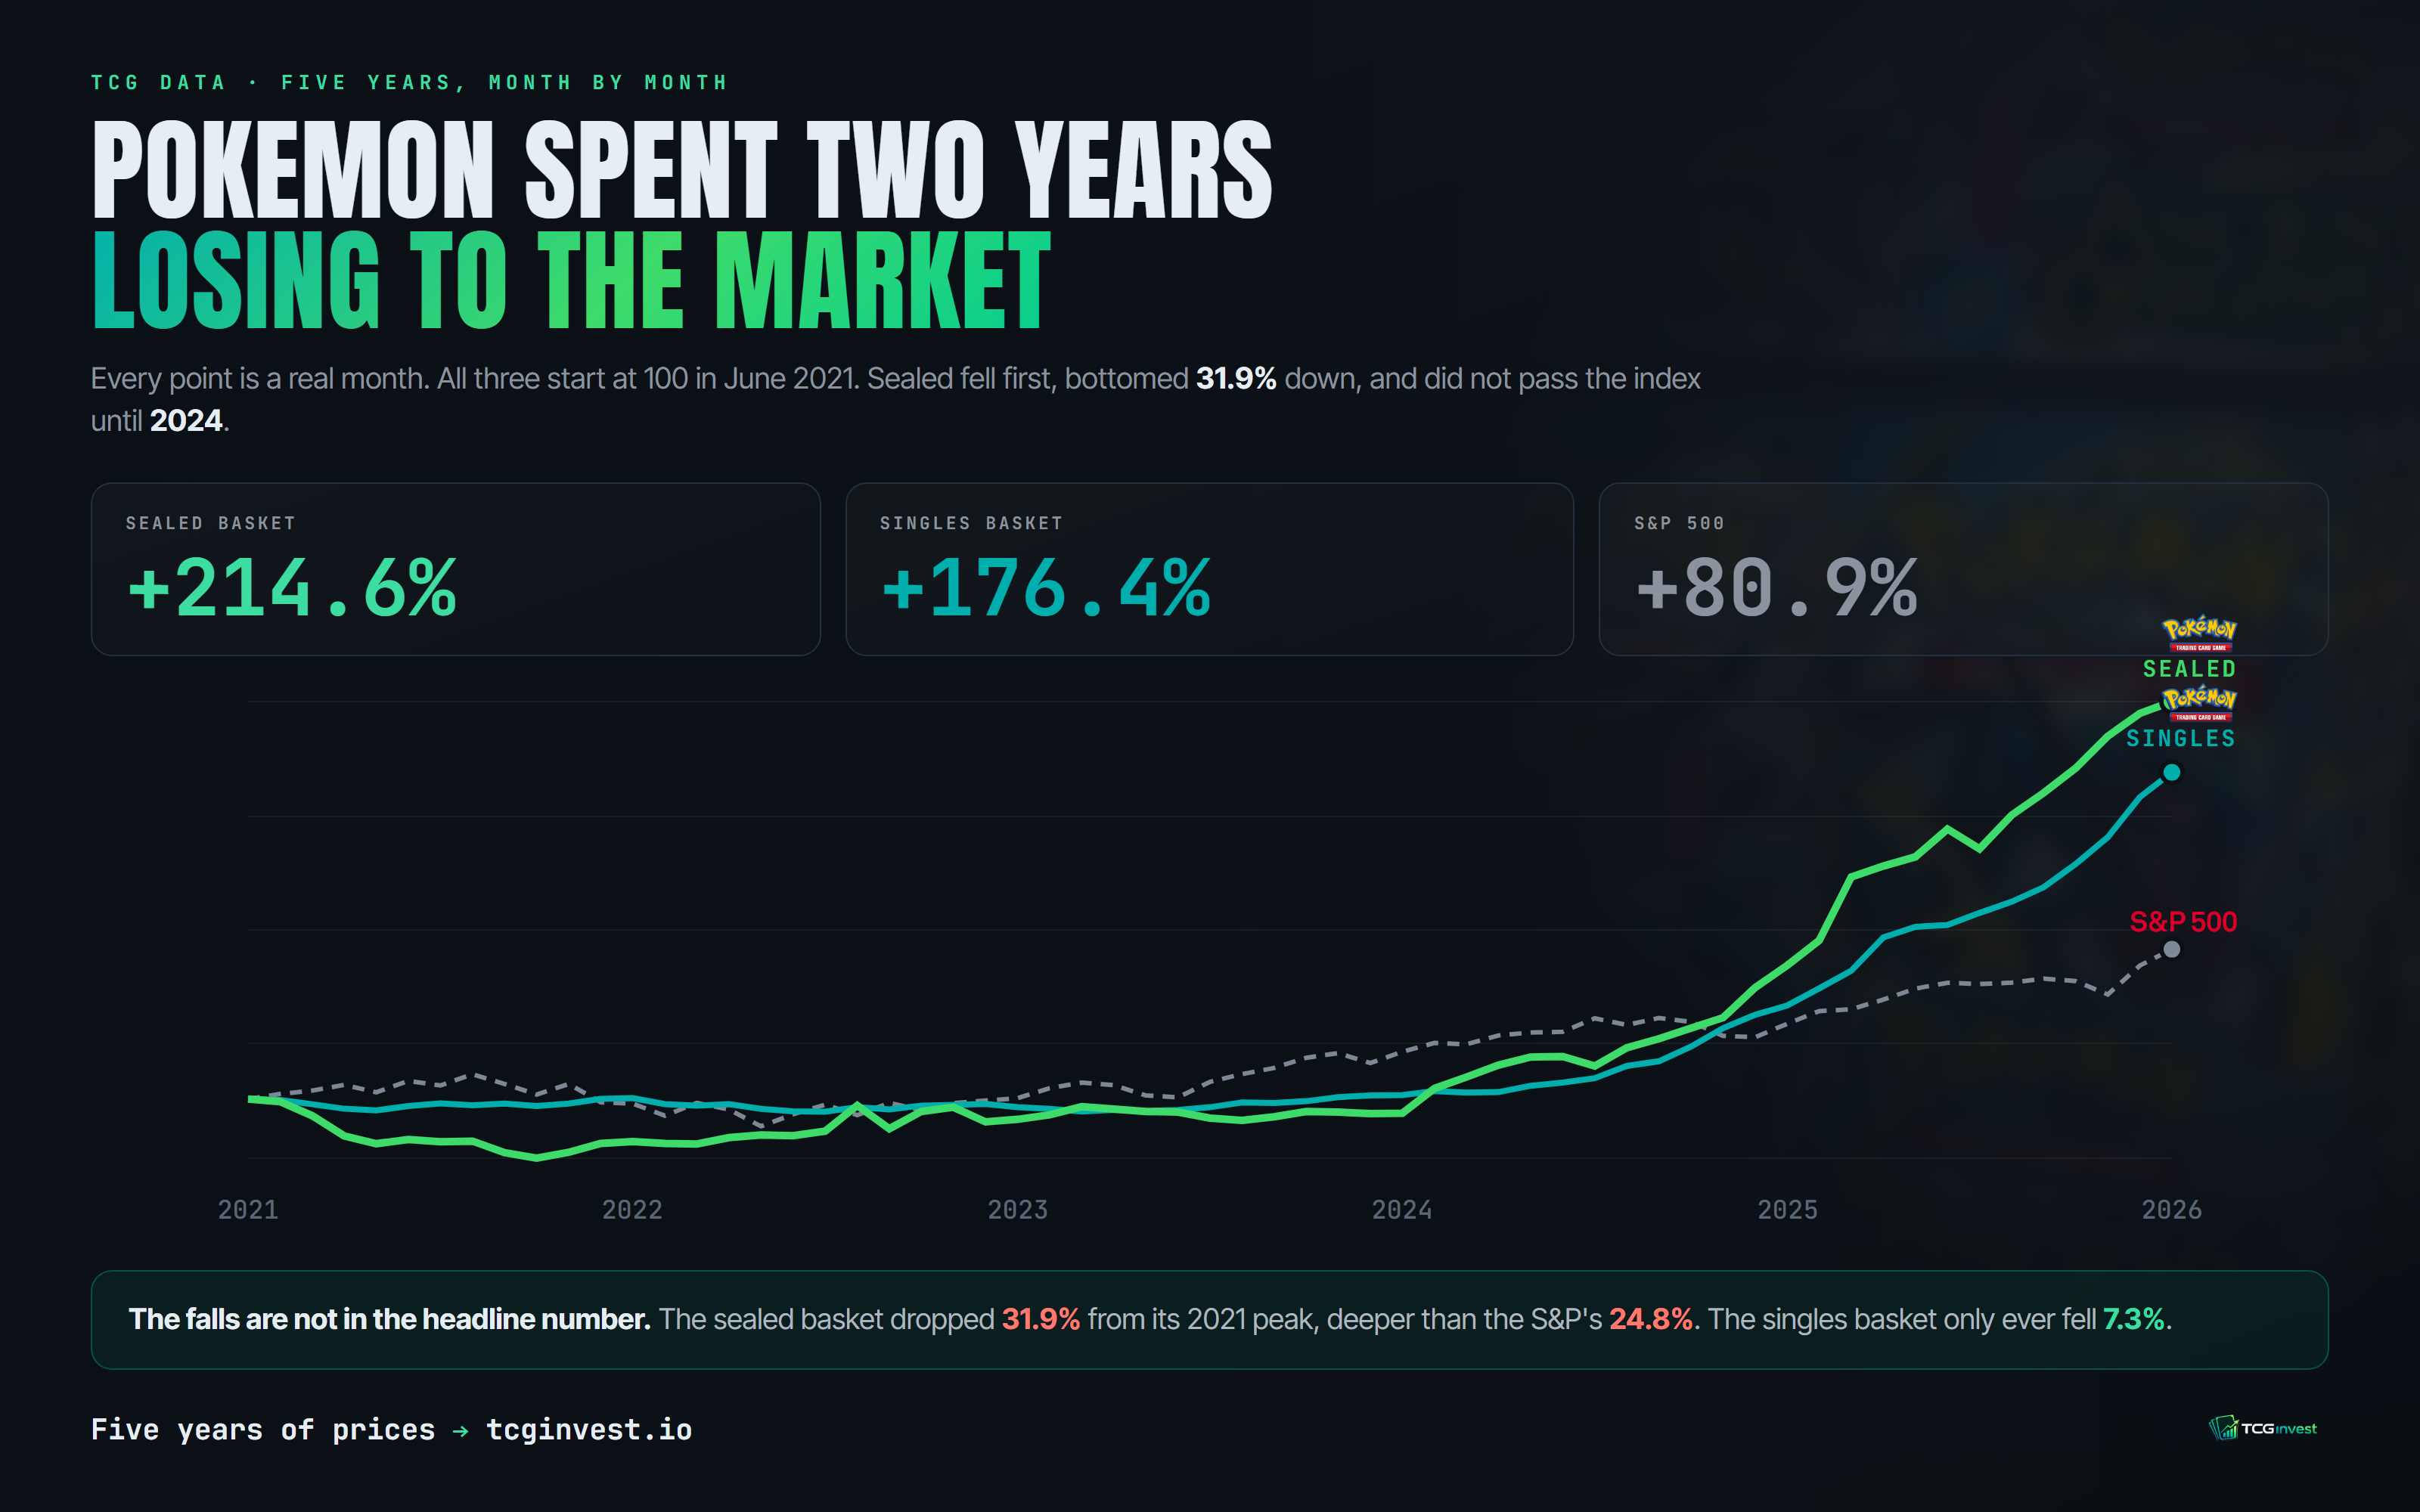
The median raw single card did not beat the S&P 500, but the full single-card basket did: +38.3% for the median card and +176.4% for the basket, compared with +80.9% for the S&P 500.
The S&P 500 moved from 4,202.04 to 7,599.96, a price return of +80.9% between 1 June 2021 and 1 June 2026.
That gives us two different comparisons for single cards.
The middle raw near-mint card rose 38.3%, less than the S&P 500's 80.9%.
But the total for the 8,881-card basket rose 176.4%, more than twice the index's price return.
Both figures are correct. They answer different questions.
The median looks at the middle card. Half the cards are above it and half are below it. The basket total looks at the combined movement of all the cards.
The reason they are so far apart is the top end. The strongest tenth of single cards gained 333.1%, while the weakest tenth lost 70.0%.
A relatively small group of very strong performers therefore had a large effect on the basket total. The middle card did not experience that result.
This is also why saying "single cards returned 176.4%" would be misleading. That is the basket total, not what happened to the middle card.
The S&P 500 figure is price return only. It excludes dividends, so it slightly understates the index's full return.
The weakest tenth: where sealed and singles really separate
The weakest tenth is where the gap becomes hardest to miss.
For sealed products, the weakest tenth gained 30.9% between 1 June 2021 and 1 June 2026.
For raw near-mint single cards, the weakest tenth fell 70.0%.
That is a 100.9 percentage point gap between the two weakest tenths.
The strongest tenth shows another large difference. Sealed products rose 1,660.6%, compared with 333.1% for single cards.
So the sealed results were stronger at both ends of the five-year period.
There is also a useful check on the size of the sealed sample.
The five-year sealed basket contains 90 products. A separate three-year window, from June 2023 to June 2026, contains 177 products.
The result is very similar. The median sealed product rose 206.4%. 94.9% of products rose. The weakest tenth gained 24.8%.
The wider three-year basket points in the same direction as the 90-product five-year basket. That is why we are confident the main result is not simply a result of having only 90 products in the longer window.
Which sealed products moved most
The biggest individual sealed-product moves in this dataset came from booster boxes.
| Sealed product | 1 June 2021 | 1 June 2026 |
|---|---|---|
| Team Up Booster Box | $101.25 | $11,425.00 |
| XY Ancient Origins Booster Box | $102.50 | $6,430.47 |
| XY Phantom Forces Booster Box | $1,100.00 | $13,796.27 |
| XY Roaring Skies Booster Box | $324.69 | $3,914.50 |
| Unified Minds Booster Box | $301.50 | $2,856.25 |
These are individual products from the 90 sealed products in the five-year dataset.
The figures show how wide the sealed results could be. The strongest tenth reached +1,660.6%, while the weakest tenth was still up +30.9%.
We are measuring prices here, not the reasons behind them. Sealed Pokémon products have a known characteristic that some units leave the sealed market when they are opened. This analysis does not measure whether that, or any other factor, caused the price changes.
Year by year, and the falls
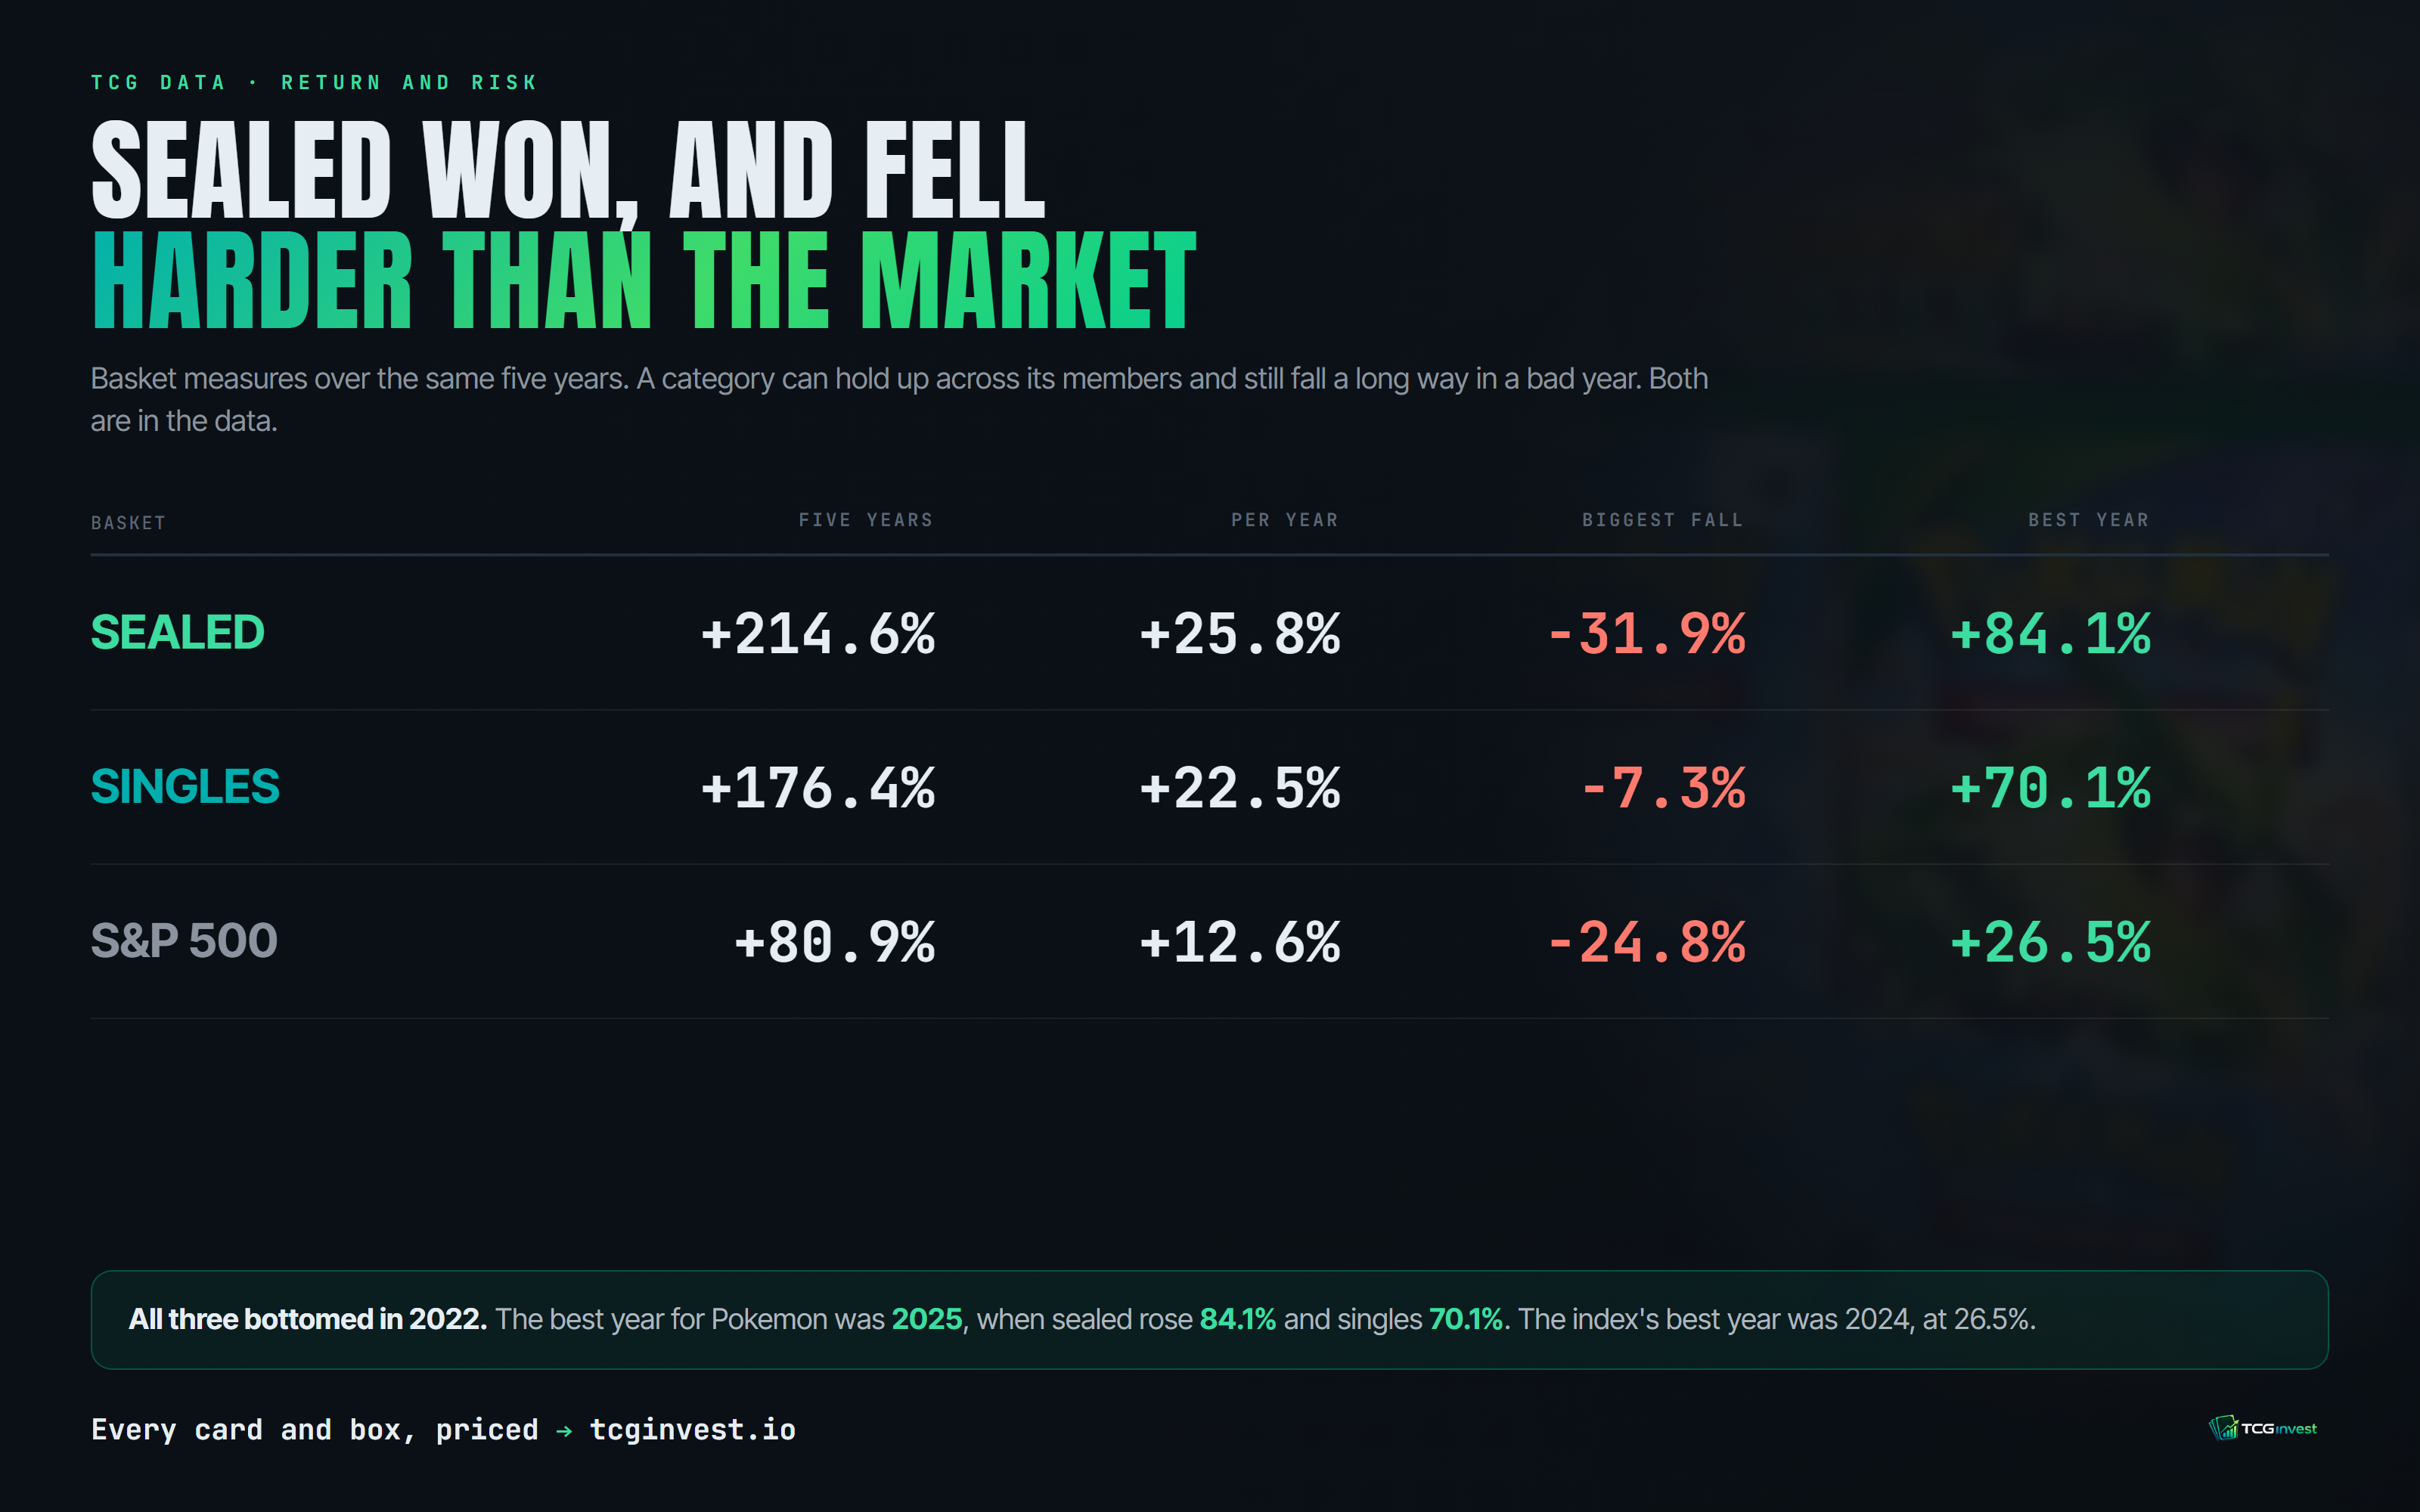
Per year, the sealed basket returned 25.8%, singles 22.5% and the index 12.6%.
The best single year was 2025, when sealed rose 84.1% and singles rose 70.1%. The index's best year was 2024, at 26.5%.
The falls tell a different story.
The sealed basket fell 31.9% from its 2021 peak, deeper than the S&P 500's 24.8%. The singles basket fell only 7.3%.
So sealed was consistent between products and volatile between months. Those are two different measurements and both are in the data. A basket can hold up well across its members while still falling a long way in a bad year.
All three baskets bottomed in 2022.
How we measured this, and what it cannot tell you
We used PriceCharting monthly median prices in USD for both Pokémon cards and sealed products. That keeps the two Pokémon categories on the same price source. The S&P 500 figures are daily closes.
The window runs from 1 June 2021 to 1 June 2026.
We included an item only when that same item had a recorded price at both ends of the window. That gives us 90 sealed products and 8,881 raw near-mint single cards. For cards, an item means the same card in the same grade tier, so a card is never compared against a different version of itself.
We excluded 359 sealed products whose price history was inherited from another product rather than observed directly. Only independently priced series are counted.
The three-year sealed check uses a wider basket of 177 products, covering June 2023 to June 2026.
Two different measures appear in this article and they are not interchangeable. The median is the middle item in a basket. The basket total is the combined movement of every item in it. The per-year and drawdown figures above are basket measures.
There are some limits.
First, both Pokémon baskets require a price at both ends. Products that stopped being tracked are not represented.
Second, all Pokémon prices come from PriceCharting. It is one price source, not a complete picture of every market or transaction.
Third, the S&P 500 comparison uses daily closes and measures price return only. Dividends are excluded, which slightly understates the index's full return.
Fourth, the sealed five-year basket contains 90 products. That is a small number, which is why the three-year check on 177 products matters.
Finally, sealed products cannot be graded and have storage and authenticity considerations that a price series does not capture.
The five-year picture is still clear.
The median sealed product rose 238.0%. The median raw near-mint single card rose 38.3%. The S&P 500 rose 80.9% on a price basis.
But the biggest difference sits at the bottom.
The weakest tenth of sealed products gained 30.9%. The weakest tenth of single cards lost 70.0%.
Over these five years, the prices of sealed Pokémon products and single cards did not simply move by different amounts. The results were spread very differently from one another.