

The hobby is arguing about a bubble again: that nothing made since 2021 is really rare, that a wave of new supply is coming, that modern is a junk-wax era waiting to happen. The worry has hard numbers behind it: the Pokémon Company has now printed more than 75 billion cards, and more than half of them have been made since 2021 alone, up from a pre-2019 pace of 1.5 to 2 billion cards a year. It's a fair worry. But it is also a testable one, because we don't have to guess what happens when a Pokémon bubble bursts. The last one already burst. We can measure what came back.
So we took 10,639 cards that were valuable PSA 10s in 2021, real, English, single-grade sold prices, and checked each one against what it sells for now. 69.2% have recovered to their 2021 level or higher, which leaves 30.8% still underwater five years on. But that average hides everything interesting. The real question is which cards came back, and which stayed stuck. We tested every obvious answer and compared how each one held up.
We're TCGinvest. We come from quant trading, and this is the kind of test you'd run on a basket of stocks after a crash: which slice recovered, and what actually explains the split. Every number here was computed from our database this week. We'll show you the method before the answer, because the method is the reason you can trust the answer.
How we measured this (the part most "studies" skip)
Before any finding, here's exactly what's under the hood, including the trap we deliberately avoided.
The price we used. For each card we used its PSA 10 sold-price history from PriceCharting: actual completed sales, month by month. One specific grade. Not a blended "all-grades" number.
What we did not use, and this matters. We did not touch Cardmarket's "Price Trend" or "average price." Those numbers blend every language and condition of a card into one figure: an English Near-Mint sale and an Italian Light-Played sale get averaged together, and filtering the page doesn't change them. A card that's €100 in English NM and €10 in Italian LP can show a "€55 average" that describes nothing real. We avoided that entirely:
- One grade: PSA 10 only.
- One language: English only.
- One printing at a time: a card's normal, reverse-holo and 1st-edition versions are tracked separately, never averaged into each other.
Which cards we included. Every card whose PSA 10 averaged ≥ $25 across all of 2021, i.e., cards that actually mattered at the top of the market. We used the full-year average on purpose, not the all-time high, so we're not committing the circular error of "cards that peaked in 2021 are below their peak" (true by definition, and meaningless). Of the 10,639 cards, 10,555 have a current price from 2026. This is now, not a stale snapshot.
What "recovered" means. Current PSA 10 price ≥ its 2021 average. Below it = still underwater.
Then we did one more thing, and it's the whole article: we sorted the recovered-vs-underwater cards by one variable at a time (rarity, price, popularity) to see which trait actually separated the survivors from the stuck. If a variable were the real cause, the split would line up behind it. Most didn't.
Candidate #1: "The rare cards recovered. The junk stayed dead."
This is the first explanation everyone reaches for, and it's a story about rarity: that scarcity is what carried a card through the crash.
We checked it the only way that settles it: hold rarity constant and look inside each tier. If rarity were the cause, the gap should disappear once you compare like with like. It doesn't move at all.
| Rarity tier | Pre-boom recovered | Boom-era recovered |
|---|---|---|
| Rare Holo | 87% | 37% |
| Rare Ultra | 89% | 35% |
| Rare Rainbow | 96% | 21% |
| Rare Secret | 71% | 2% |
Same rarity label, opposite outcome. A Rare Ultra recovered 89% of the time, or 35%, depending on something that has nothing to do with the word "Ultra." (You can already see the variable that's doing the work in the column headers; we'll get to why in a moment.) So rarity isn't what's driving the gap.
Candidate #2: "It was just the expensive cards."
Second instinct: maybe rarity is a proxy for price, and it's really the pricey cards that recovered. So we raised the price floor and re-checked the same split at each level.
| Price floor | Pre-boom recovered | Boom-era recovered |
|---|---|---|
| ≥ $25 | 73% | 31% |
| ≥ $50 | 77% | 25% |
| ≥ $100 | 79% | 27% |
The gap doesn't close as cards get more expensive. If anything it holds firm. Honest exception: above $250 the boom-era sample shrinks to just 32 cards and the gap narrows. Why so few? The boom era is only two years of sets (957 cards in this whole study), and just 32 of them had a PSA 10 worth $250 or more back in 2021. Modern cards also have no '1st Edition' printings to swell the count the way vintage does, so there is no hidden pool of them. At 32 cards it is noise, not a reversal. Through the range where the data is dense, price is ruled out too.
Candidate #3: "It was the popular Pokémon, Charizard, Umbreon, the chase mons."
This one is different, because it's the one that's partly right, and the honest version of this article has to say so.
We split the cards by whether each one features a perennial chase Pokémon (, , the , Rayquaza, Mewtwo, Lugia, Gengar, and a few others; a name-match disclosed in the methodology) versus everything else, within each era:
| Era | Chase Pokémon | Everything else |
|---|---|---|
| Pre-boom | 92% (n=541) | 72% (n=9,141) |
| Boom-era | 75% (n=63) | 28% (n=894) |
Popularity clearly helps: a chase Pokémon recovered better in both eras. A chase boom-era card recovered 75% of the time versus 28% for an ordinary one. (That boom-era chase cell is only 63 cards: directional, not gospel. But the direction is the same in the much larger pre-boom row, which is why we trust the pattern even if not the decimal.) So "which Pokémon" is not ruled out. Hold that thought: it's the second half of the answer, not a competitor to it.
The variable that survived: when the card was printed
Here's what was sitting in those column headers the whole time. Split the cards by print era (the year the set was released) and a clear gradient appears, with a cliff at the end:
| Print era | n | Recovered |
|---|---|---|
| Vintage (1999–2010) | 5,446 | 77% |
| Middle era (2011–2016) | 2,711 | 73% |
| Late pre-boom (2017–2019) | 1,525 | 59% |
| Boom-era (2020–2021) | 957 | 31% |
Resolve it year by year and the shape is clear: a gentle drift down through the pre-boom years, then a cliff at the boom:
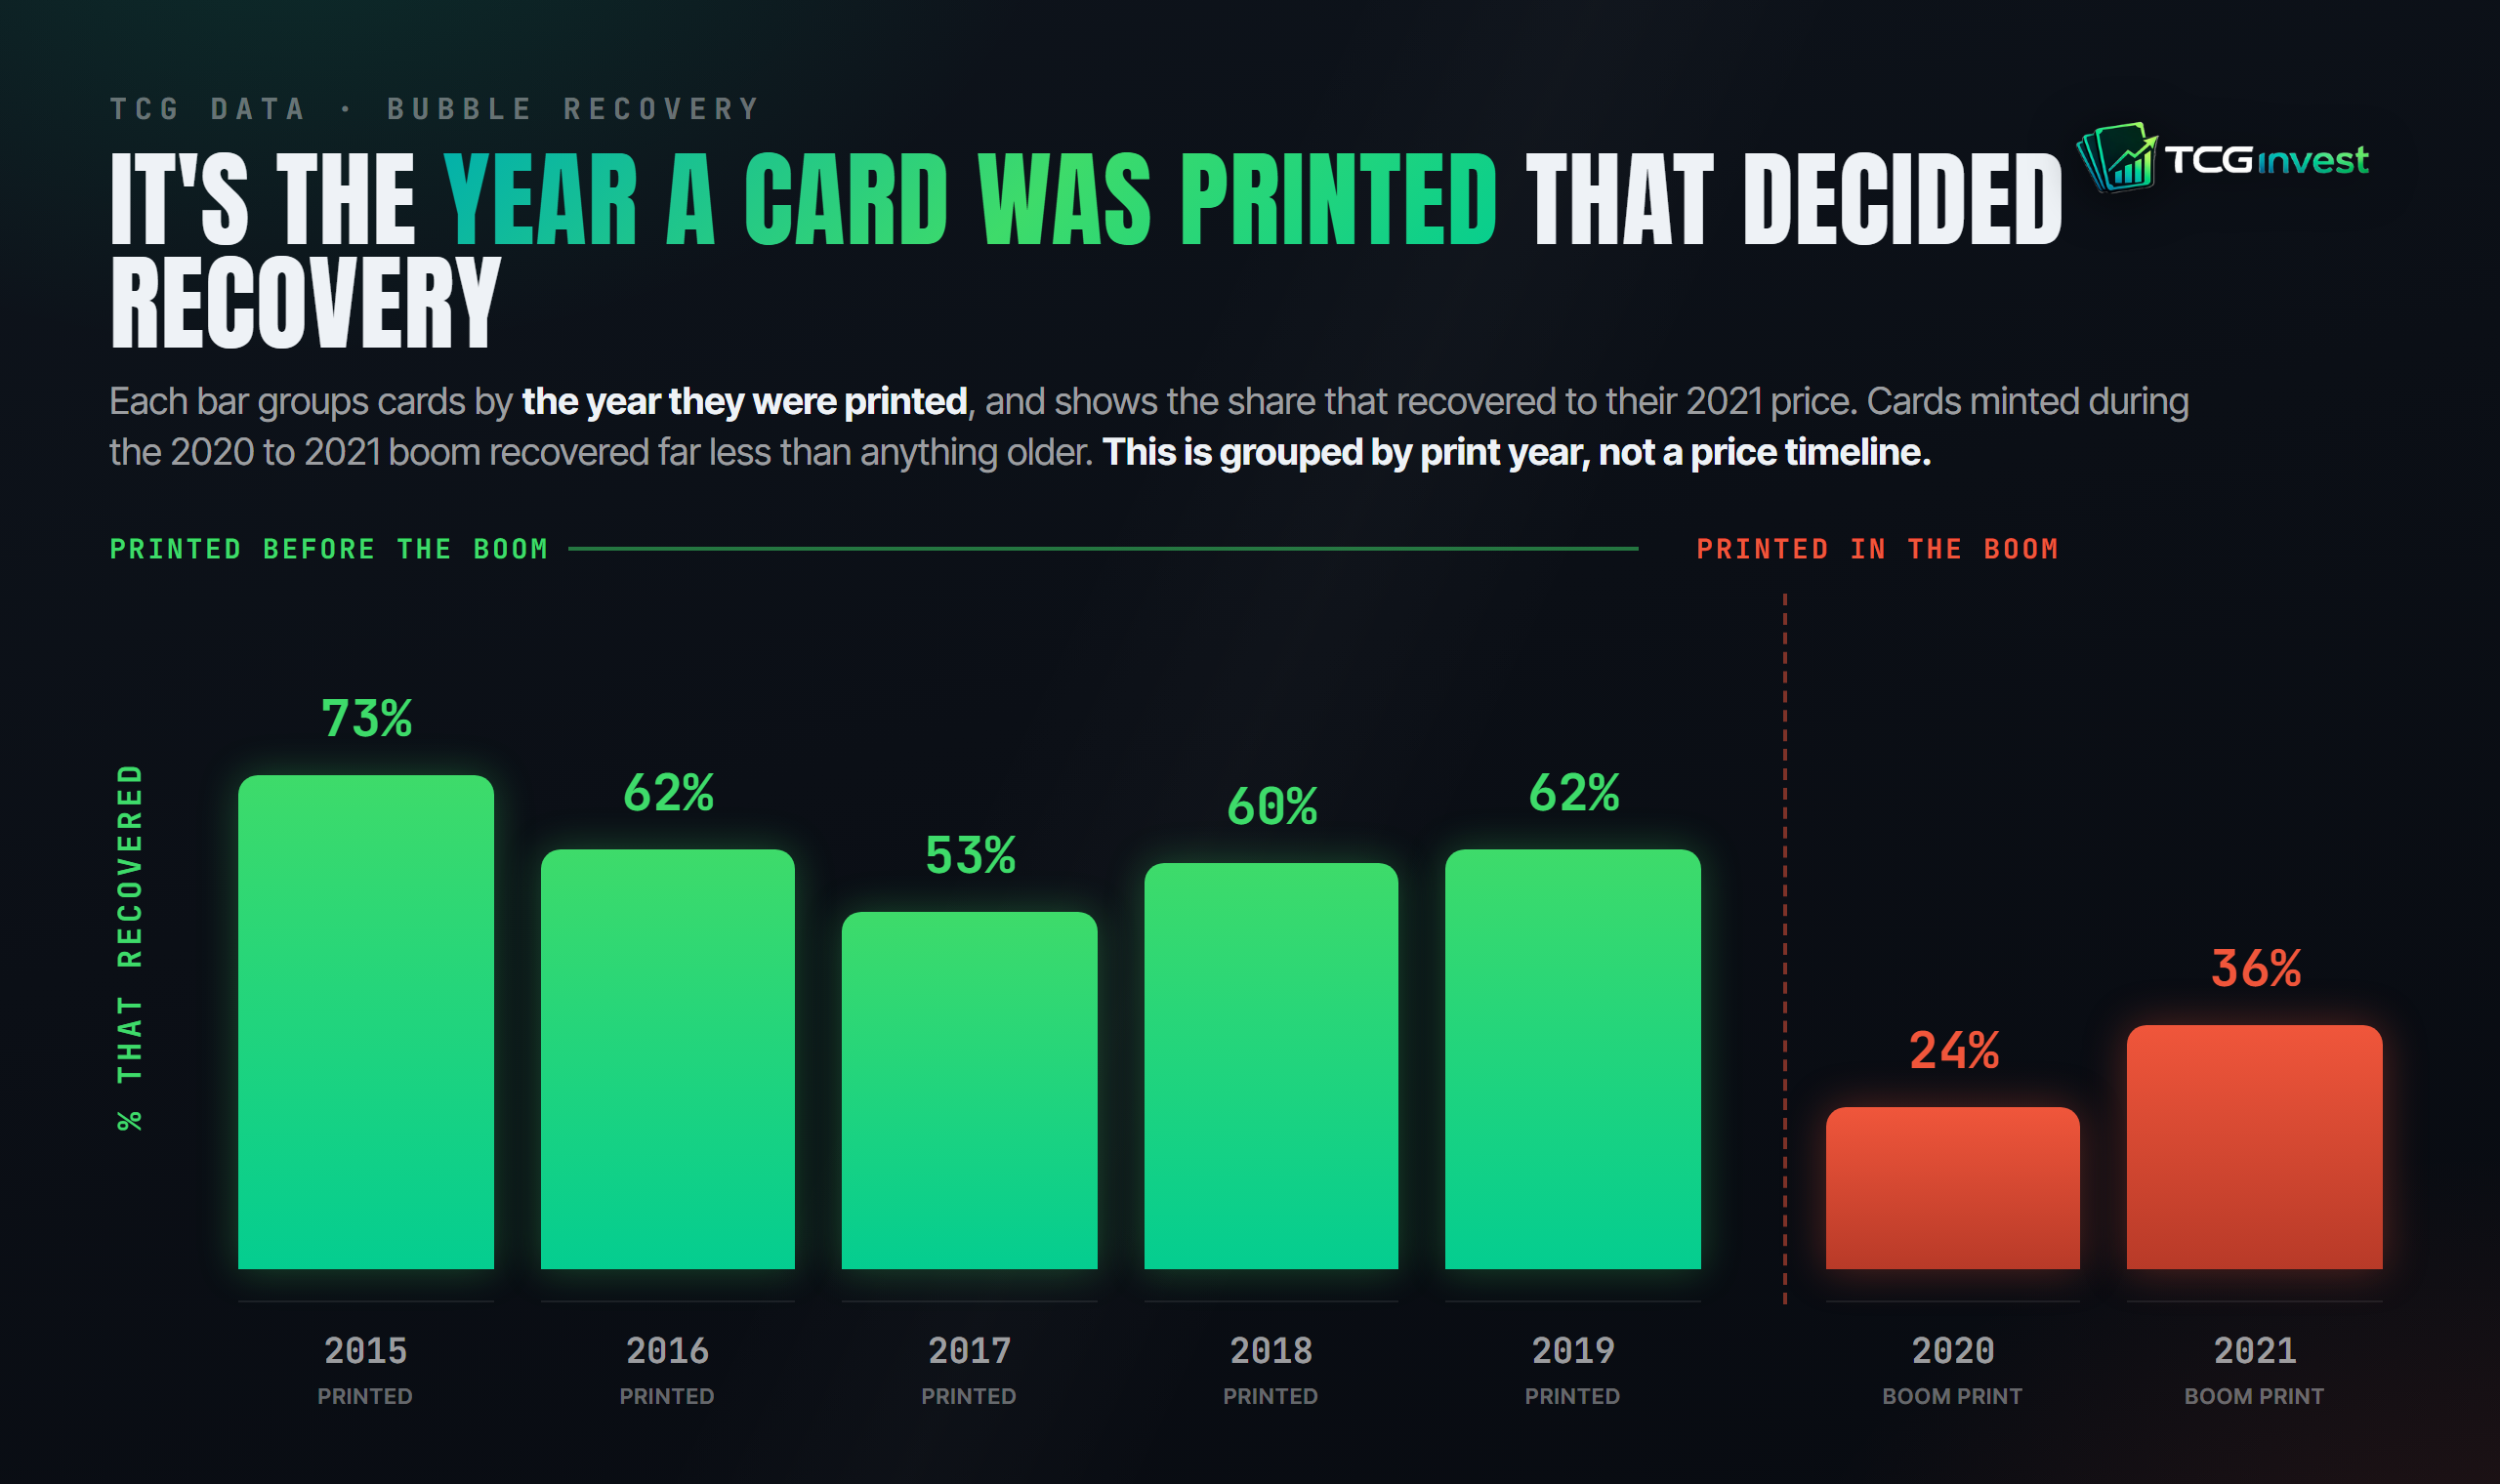
And this is not an artifact of lumping decades-old Base Set cards into one giant bucket. Even the newest pre-boom sets (Sun & Moon, 2017–2019) recovered 59% of the time, nearly double the boom era's 31%. The rate drifts down gently as cards get newer, then collapses at the 2020 boundary. As Candidates #1 and #2 showed, the gap survives holding rarity and price constant. Print era is the divider.
One more test: all four at once
Testing variables one at a time invites a fair objection: maybe they interact, and the real driver only shows up when you weigh everything together. So we did exactly that, a single model that accounts for print era, price, rarity, and chase status at the same time. The result was clean. Print era stayed by far the strongest signal: a boom-era card had less than one-eighth the recovery odds of a pre-boom card, even after holding price, rarity, and popularity constant. Price, on its own, vanished, it carried no independent predictive power once era was in the model. Chase status and rarity each kept a real but smaller effect. The one-at-a-time story and the all-at-once story agree.
Putting it together: the real signal is pre-existing demand
Now fold Candidate #3 back in, because era and popularity aren't two rival answers. They're two faces of the same one.
Our reading is simple: a card recovered if its demand existed before the bubble. There are two ways to have that:
- The card itself predates the boom. It had already found its real level by 2019, so the mania was a spike on top of a floor, and the floor was still there afterward.
- The Pokémon is a permanent chase. Charizard demand doesn't depend on any single boom; it predates all of them. That's why a chase card minted during the boom (75%) still behaved more like an old card than like its boom-era neighbors (28%).
You can see both halves of that rule in two cards. One predates the boom, the other is a permanent chase. Both came back.
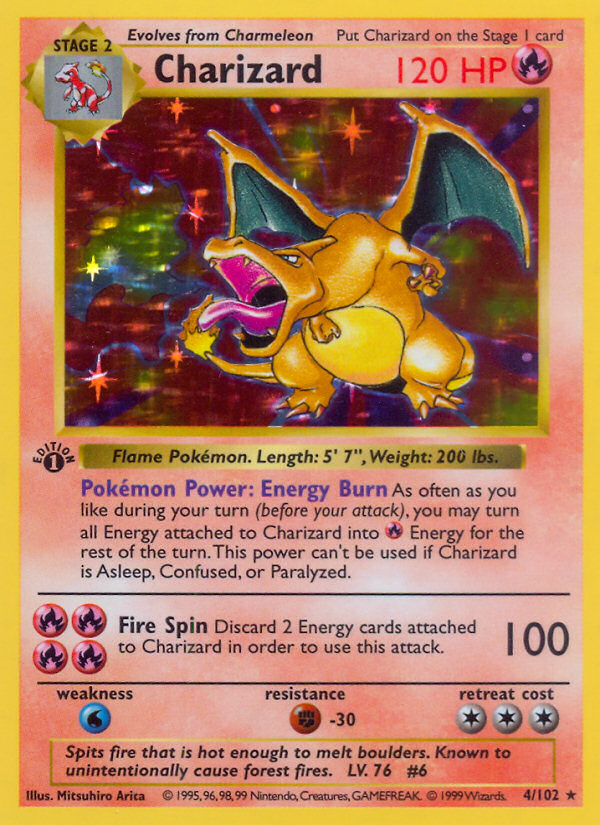

And the cards that stayed dead? The ones with neither: a new card and an ordinary subject, whose entire demand was manufactured inside the mania and evaporated with it. That's the boom-era + ordinary group: 28% recovered. It's also, almost exactly, the hobby's own "nothing since 2021 is really rare" thesis, measured.
So what does this say about now?
Observationally, characterizing what the last burst did, not predicting the next one: when a Pokémon bubble corrects, the cards that historically clawed back shared one trait: demand that existed before the hype. The cards that didn't were the ones the hype created. If you're trying to read the current market through the last one, that's the line five years of data actually drew, not rarity, not grade, not price.
We're not calling a crash, and we're not naming cards to buy. We're telling you which variable, in the one bubble we can fully measure, separated what came back from what didn't.
What this does not mean (read this part)
We publish the caveats because the data is solid. That's the difference between research and finance fluff.
- It's one bubble. This is a single historical episode, not a law of nature. "What helped recovery last time" is a strong tendency, not a guarantee about next time.
- Our data starts at the peak. The PSA 10 series begins December 2020, at or after the top. So we measure recovery from the 2021 level forward, over what was a documented 2024–2026 upswing. We can show you what came back; we cannot show you the full depth of the hole everything fell into, because the data doesn't start early enough. We say so out loud.
- "Recovered" is relative, not a return. Back to the 2021 nominal price means the level was reclaimed. It isn't a profit figure, and we're not implying one.
- The popularity cut is thin where it's newest. The boom-era chase group is 63 cards. We lead on the era split (n=9,682 vs 957) because it's where the data is deep, and treat the popularity finding as a directional second factor, not a decimal to bank on.
- "Chase" is a name-match. We flag a fixed list of perennial-chase Pokémon by name; it's a reasonable proxy for popularity, not a perfect one.
- We didn't test everything. Other factors surely matter too: set size, PSA population, alternate-art or trophy status, playability. Among the broad variables we did test, print era produced the clearest and largest separation, but it is not the only thing moving these prices.
How TCGinvest uses this
This is the kind of structure our model is built to surface rather than bury. When we characterize a card, release era is a first-class input alongside grade, rarity, and realized-price history, because in our own data, when a card was minted and whether its demand predates the hype carry more recovery information than the rarity stamp on it. We'd rather hold our model to the thing the data supports than the thing the hobby assumes.
FAQ
Doesn't this just prove "nothing since 2021 is rare"? In part, yes, and we agree with the hobby on the mechanism. Boom-era sets were printed into the biggest demand spike the hobby had seen, in its largest print runs; when demand normalized, the supply didn't. Our finding adds the measurable edge: it's print timing, not the rarity stamp, that predicts recovery, and it holds inside Rare Holo, Rare Ultra, Rare Rainbow and Rare Secret alike (n=10,639).
Why measure recovery instead of the full crash? Because recovery is the question that actually matters if you hold these cards: of the cards that were expensive at the top, which ones came back? Our graded data begins December 2020, so we scope deliberately to the 2021 level forward. That's the right question answered with the data that exists, rather than the wrong question answered with data that doesn't.
Isn't the boom-era sample too small? It's n=957 against 9,682 pre-boom: smaller, not tiny. And resolving it by single year shows a clean break at the boom boundary (every pre-boom year in the low-50s to low-70s; both boom years in the mid-20s to mid-30s), not noise.
Is this financial advice? No. It's research and education. Past tendencies do not guarantee future results.
See it on real cards, live
(Rankings are transparent model output, not buy recommendations.)
The takeaway
The hobby's bubble anxiety is reasonable, but the last bubble already answered the question everyone's asking. What recovered wasn't the rarest, the priciest, or the most hyped. It was the cards whose demand existed before the mania: old cards, and the handful of Pokémon people never stop wanting. What stayed underwater was demand the mania invented. If there's a signal in five years of post-bubble data, that's it: the market gives back to the cards it already wanted.
Methodology: PSA 10 monthly sold medians from our PriceCharting-sourced graded database (series begins 2020-12), English cards only, tracked per printing (card_id + variant), never blended across language, condition, or grade. Sample = 10,639 card-variants with a 2021 full-year average PSA 10 median ≥ $25; "recovered" = latest-month PSA 10 median ≥ the 2021 average (10,555 of 10,639 priced in 2026). Variables tested by holding others constant: rarity (era gap persists in every tier), price ($25/$50/$100 floors; >$250 boom n=32 flagged), and popularity (perennial-chase Pokémon by a disclosed name-match; boom-era chase n=63, treated as directional). Rarity is each card's official catalog rarity; modern tier names (Rare Ultra, Rainbow, Secret) exist only in newer sets, so within-tier comparisons for those tiers weigh late-pre-boom cards against boom-era ones. We also ran a logistic regression controlling for print era, log price, rarity, and chase status jointly: print era was by far the strongest predictor (boom-era recovery odds ratio about 0.12), price had no independent effect (p about 0.73), and chase and rarity each retained a smaller significant effect. Print era = set release year; pre-boom ≤2019 (n=9,682), boom-era 2020–2021 (n=957). Recovery is measured from the 2021 level forward over a documented upswing and does not capture pre-2021 crash depth. One historical episode; a tendency, not a law. Research and education, not financial advice. Past tendencies do not guarantee future results. TCGinvest is not affiliated with Nintendo, The Pokémon Company, or any TCG publisher.