
Our earlier drawdown study measured how far Pokemon cards fall. Several readers pushed back with the same fair point: investors do not buy "the whole pool", they buy investment-grade cards - and three of them asked for the graded version. This is that study, extended to the full question: across the same five years, was it better to hold raw singles, PSA 10 slabs, or sealed product?
This is a TCGinvest analysis of 1,238 raw singles, 426 PSA 10 markets and 391 sealed products, all investment-grade, all measured monthly from January 2021 to June 2026. We measured return, volatility, maximum drawdown, time underwater, and the metric that ties them together: return earned for every unit of pain - annual return divided by the worst fall you had to sit through, which finance calls the Calmar ratio.
Key findings, up front:
- Sealed finished first across every major metric we measured: highest return, smallest falls, fastest recoveries.
- The median raw card fell 60% from its peak - but a basket of all 1,238 raw cards never fell more than 12%. Spreading across many cards reduced maximum drawdown by roughly 48 percentage points.
- "Vintage is safest" finished last: the oldest cards returned the least per unit of drawdown, in both the raw and PSA 10 groups independently.
- Charizard was the weakest character group to hold (+10.7% per year); Rayquaza the strongest (+29.1%).
- Mid-scarcity cards beat the rarest cards. Scarcity alone was not linked to protection.
- Loose booster packs behaved half like singles - the sealed advantage lived in boxes, blisters and collections.
Collectors have argued for years about which of the three is the safer long-term hold, and most of those arguments run on memorable examples: a Base Set Charizard, an Evolving Skies booster box, a friend's PSA 10 that halved in the slab. Examples are not the market. This study measures 2,055 assets through the same five years to see which patterns actually held across the hobby.
One scope note before the results. The universe was fixed before the results existed: the same public investment-grade gates our site applies to every card (at least 15 tracked sales in 180 days, at least $20 raw), one print variant per card, and an artifact filter - no hand-picking winners, no "random ARs and bulk". "Peak" always means each asset's own 2021-era high, not its release week. And this measures one specific window; it forecasts nothing. The full rules sit in the methodology box near the end.
The scoreboard
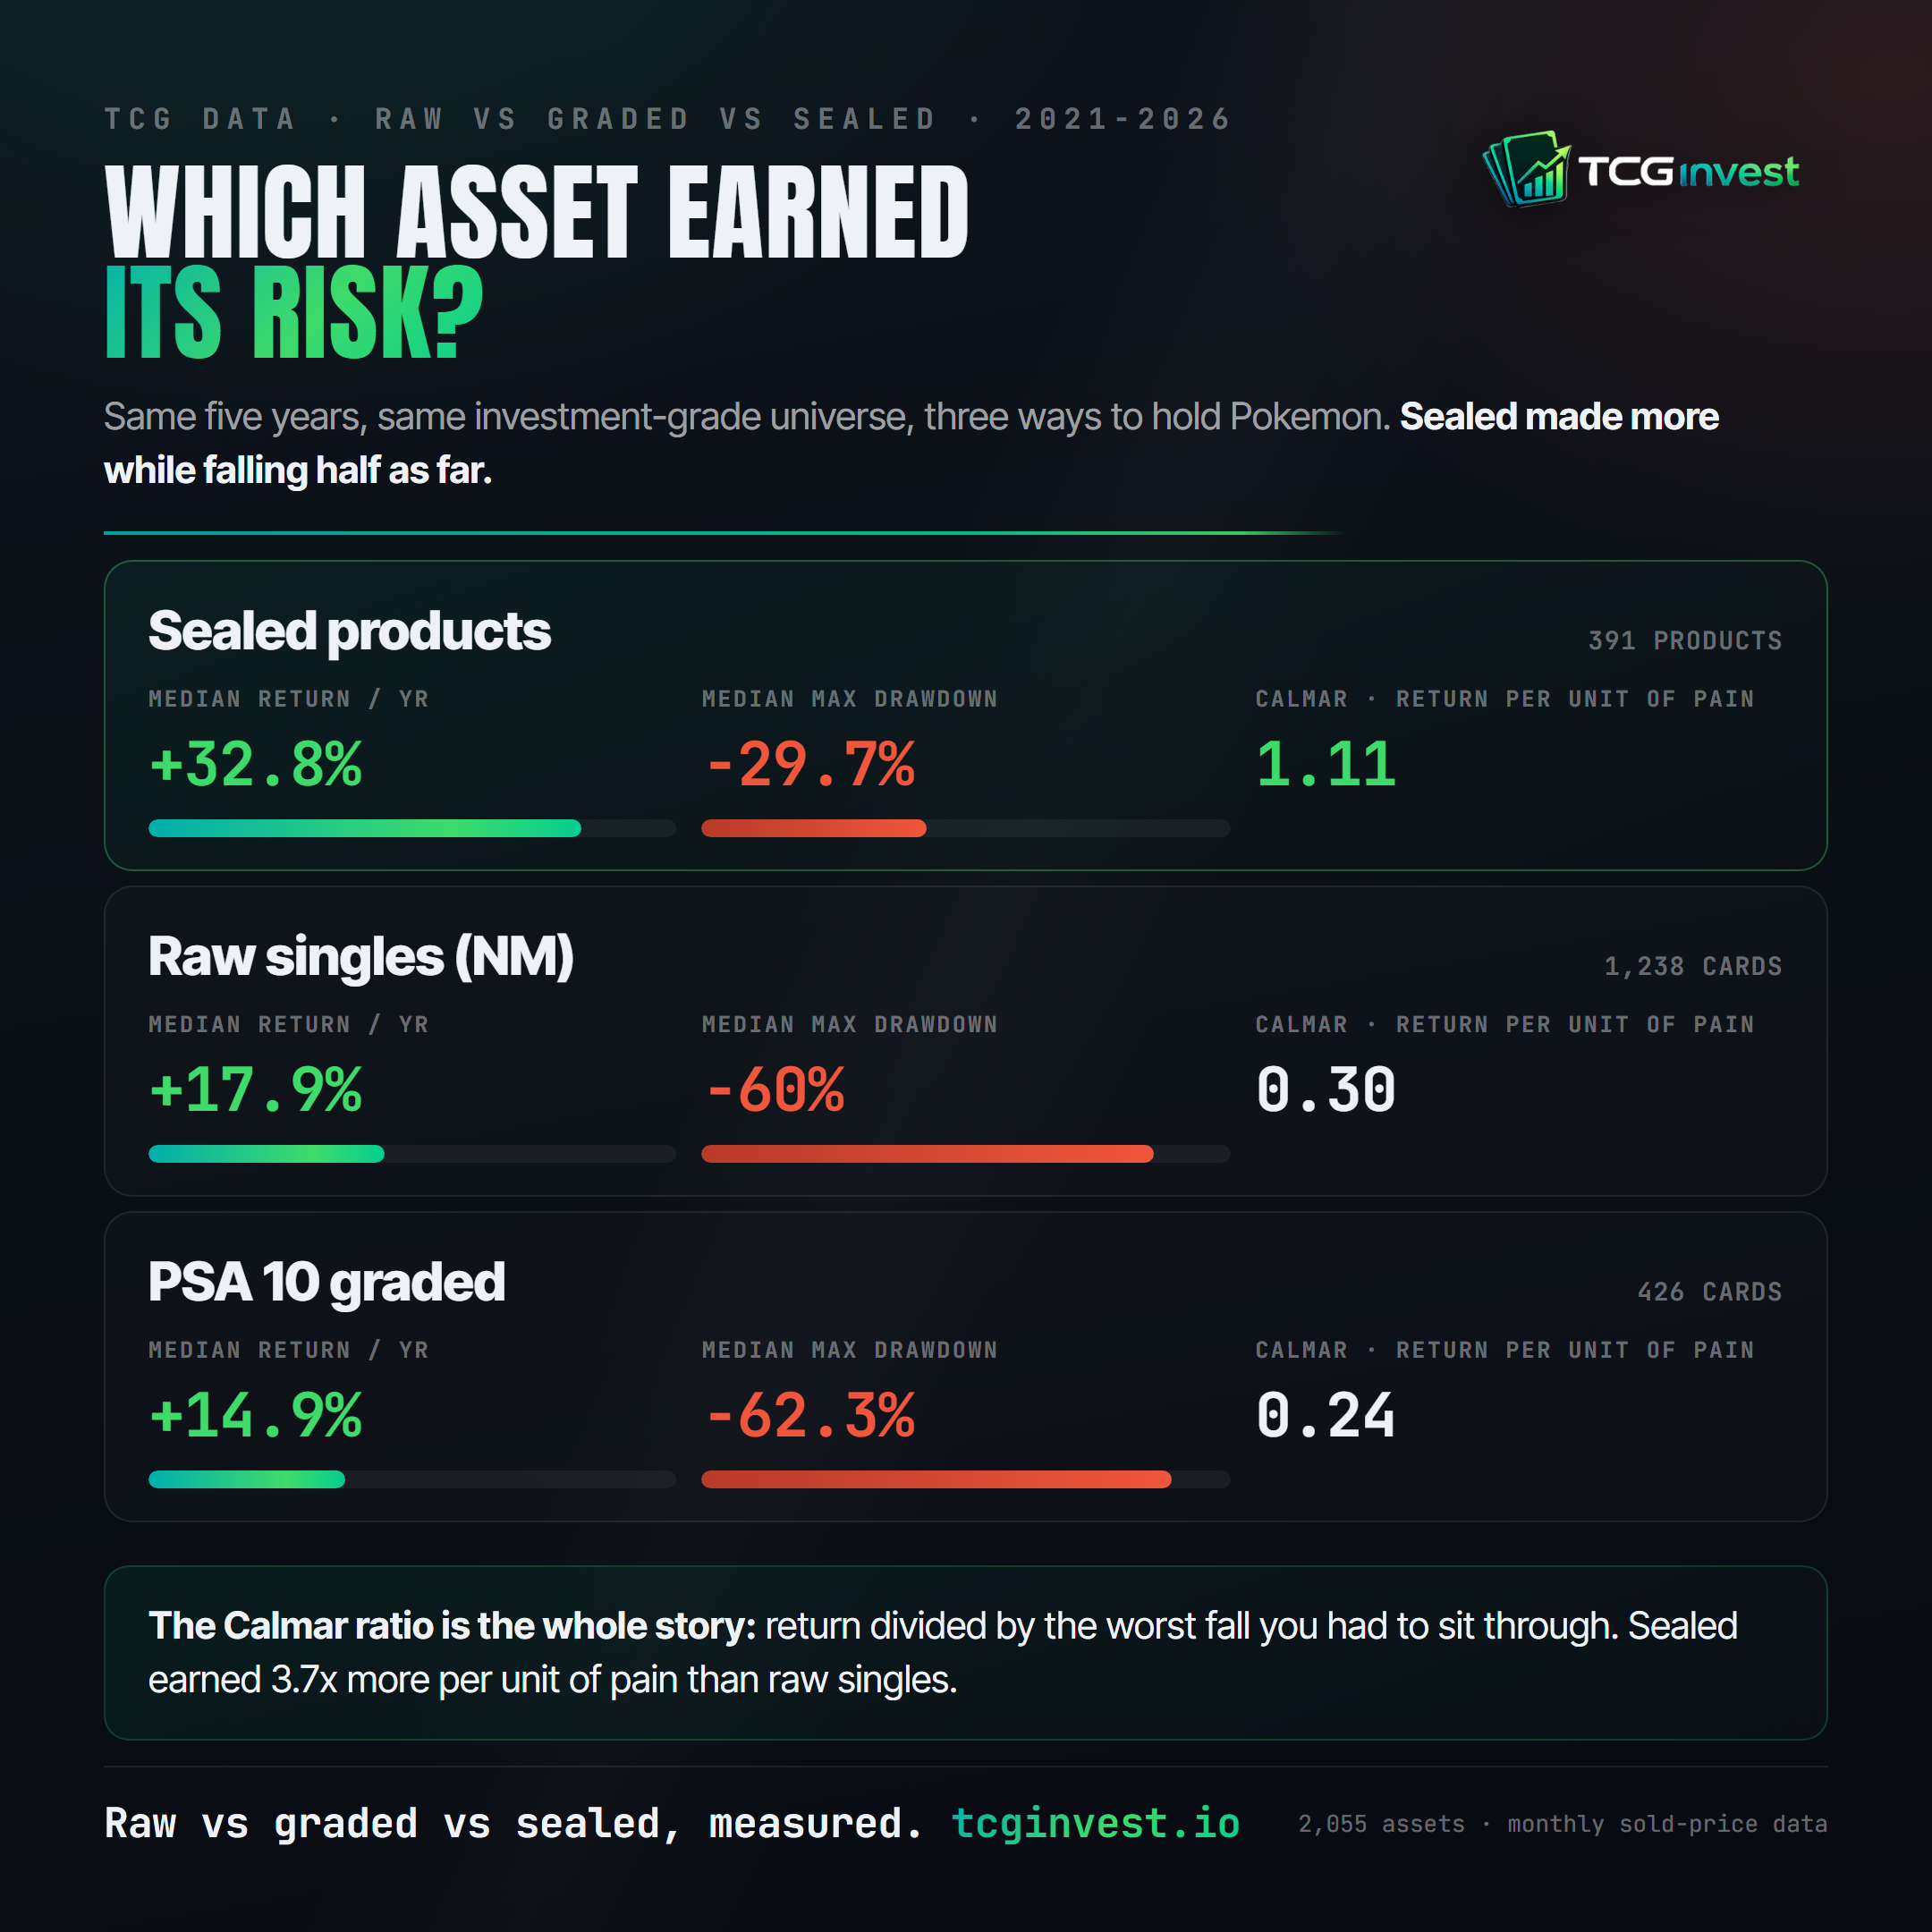
| Median per asset | Sealed (391) | Raw NM (1,238) | PSA 10 (426) |
|---|---|---|---|
| Return per year | +32.8% | +17.9% | +14.9% |
| Total return, full window | +312.6%* | +143.7% | +108.3% |
| Max drawdown | -29.7% | -60.0% | -62.3% |
| Months spent underwater | 73% | 86% | 84% |
| Annualized volatility | 35% | 76% | 48% |
| Calmar (return / worst fall) | 1.11 | 0.30 | 0.24 |
| Sharpe | 0.87 | 0.25 | 0.32 |
| Sortino | 1.88 | 0.50 | 0.52 |
*Sealed total is the equal-weight basket; medians per product are consistent with it. Full definitions in the methodology box.
Sealed finished first across every major metric we measured. Not by a little: per unit of worst-case pain, sealed paid roughly 3.7x what raw singles paid and 4.6x what PSA 10s paid over this window.
The singles rows carry one nuance. Raw beat PSA 10 on return per drawdown, but PSA 10 swings with far less month-to-month noise (48% vs 76% volatility) while falling deeper at the worst point. Which single-card group "won" depends on whether risk means the bumpy ride or the worst valley. Neither came close to sealed on either definition.
The biggest surprise was not sealed winning
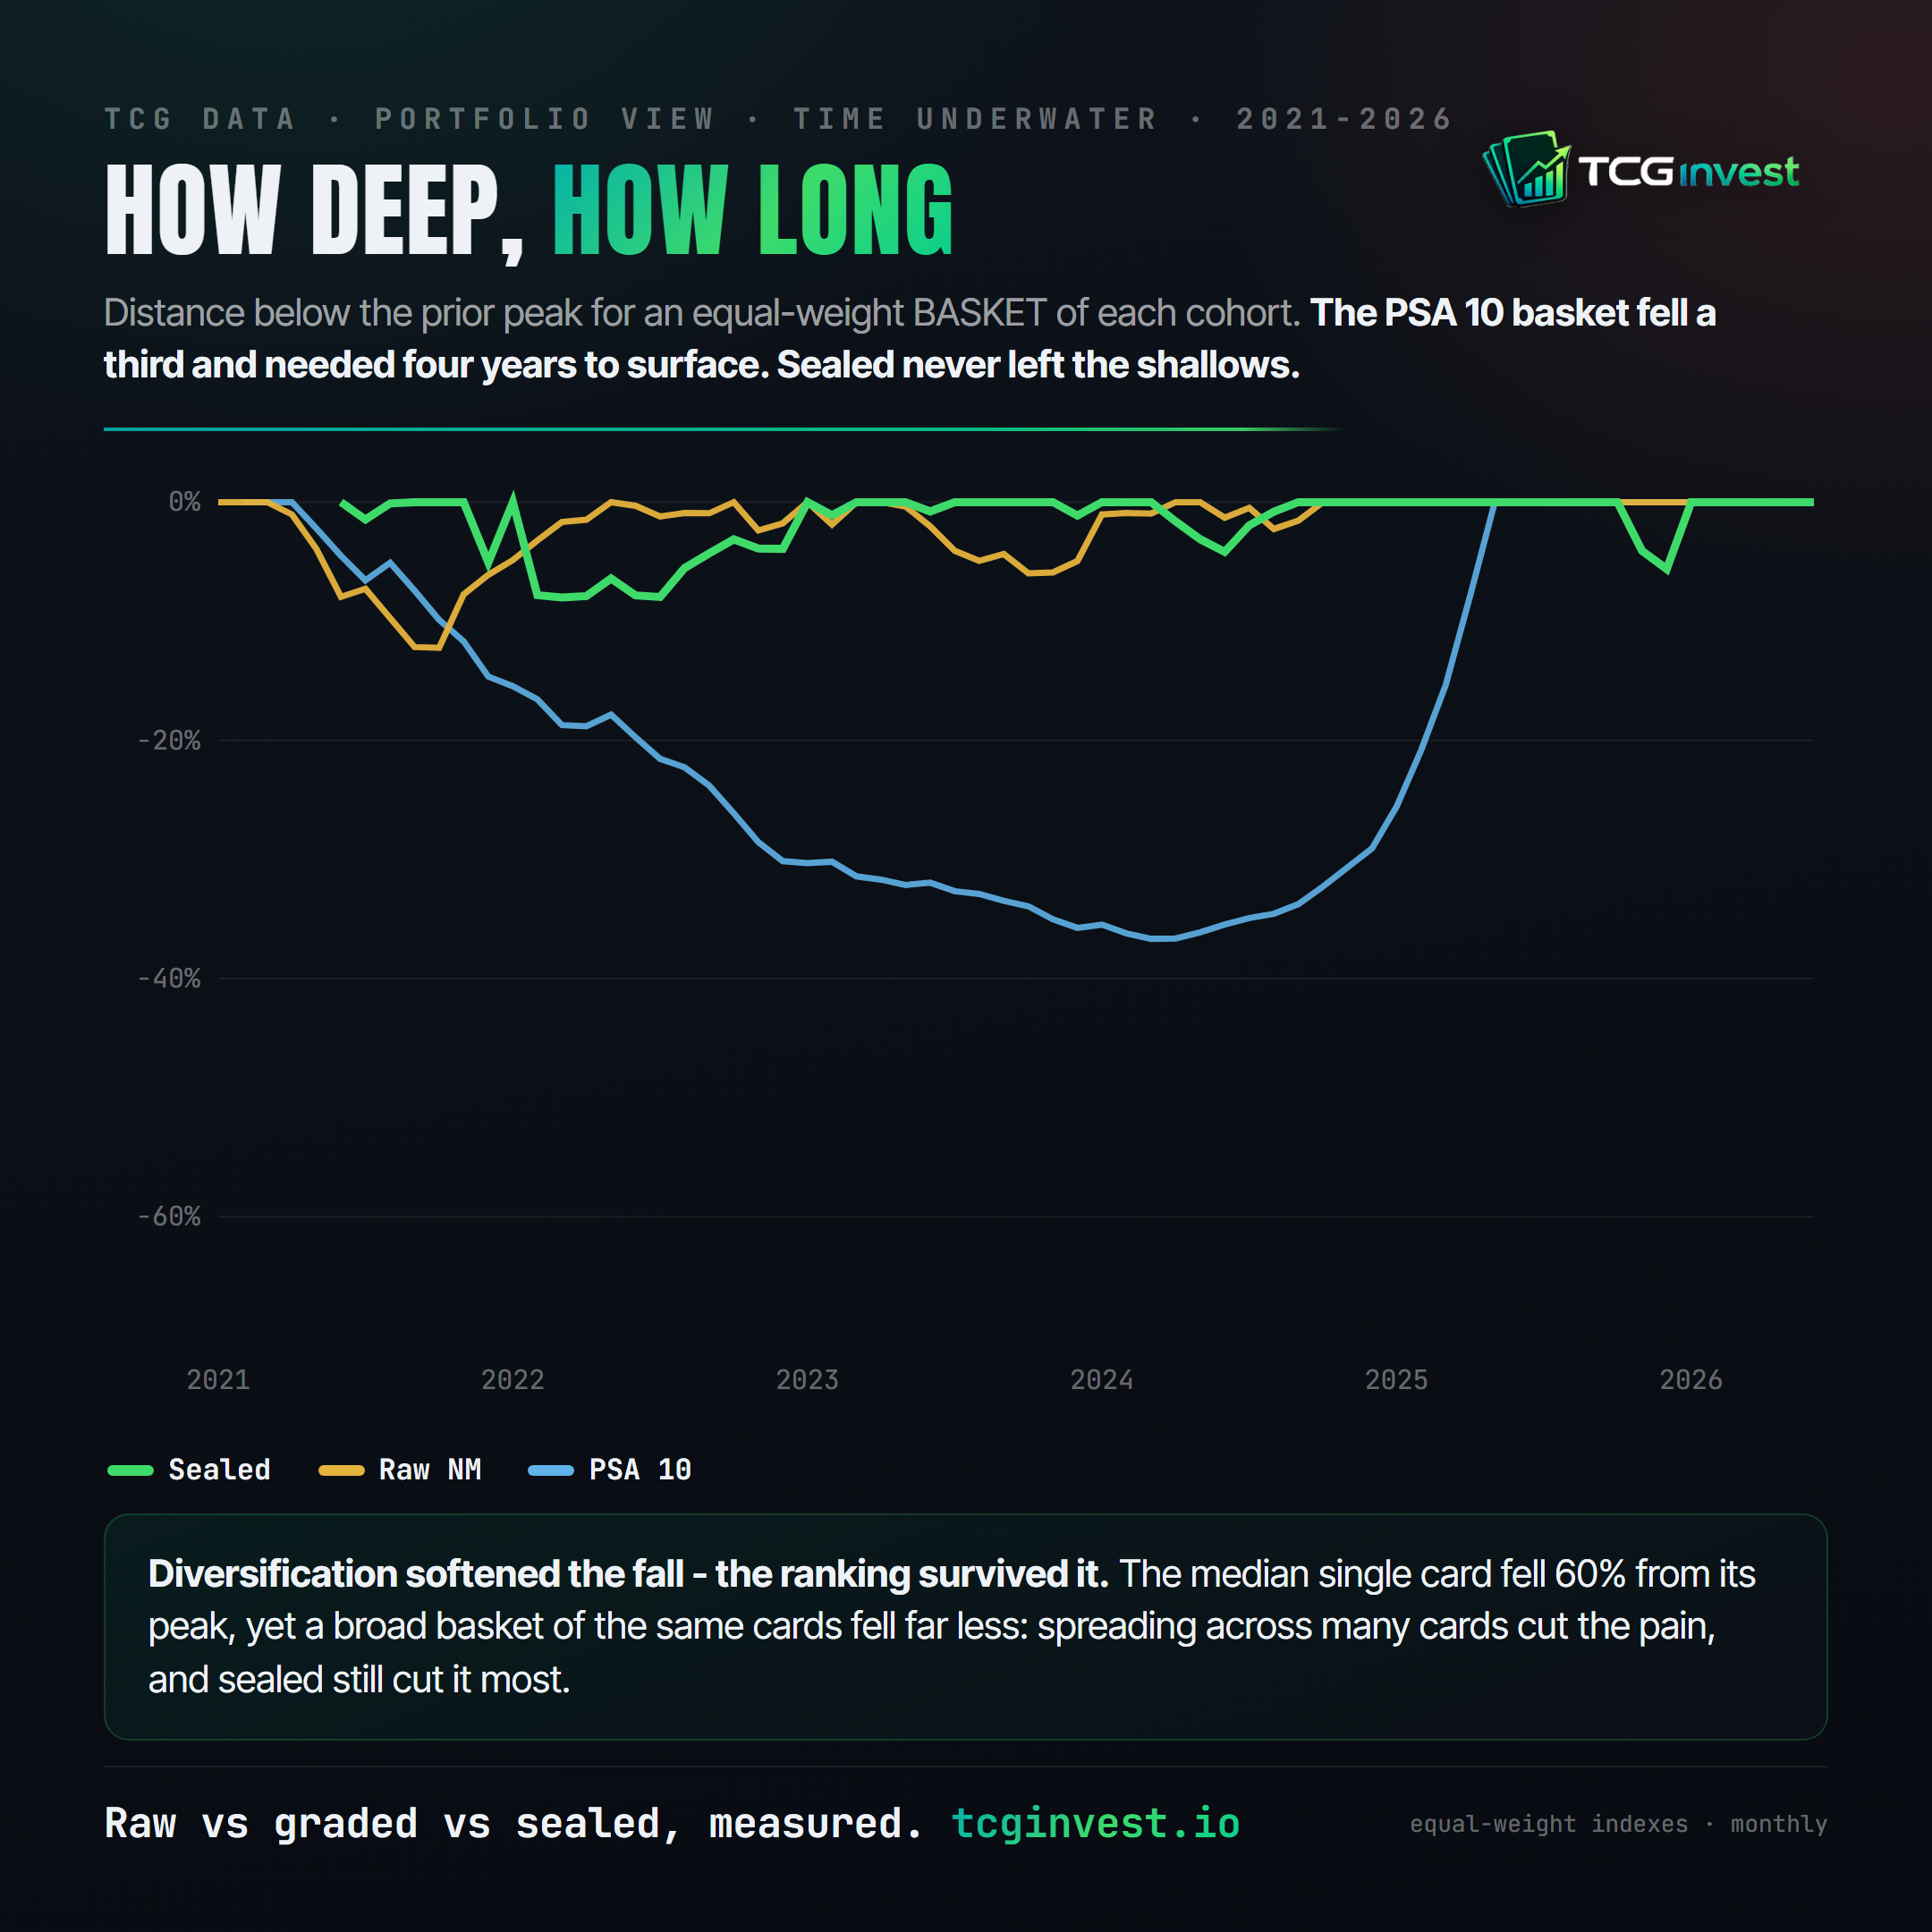
One raw card: -60%. A basket of all 1,238 raw cards: -12.2%.
Both numbers describe the same market. The median raw card fell 60% from its peak, consistent with our drawdown study, yet an equal-weight basket of every raw card in the universe never fell more than 12.2% below its own peak. Spreading investments across many cards reduced maximum drawdown by roughly 48 percentage points in this dataset.
Why? Individual cards did not crash on the same schedule. A 2016 holo could be bottoming while an EX-era chase was already recovering. Each card's worst moment was severe, but the basket never had all its worst moments at once, so the average stayed shallow while its members took turns falling. Owning just one raw card was extremely risky. Owning many, spread across eras and characters, was not remotely the same bet.
The PSA 10 basket shows the same idea from the opposite direction: graded prices fell together (one grading boom, one shared crash), so spreading out helped far less - the basket still went -36.7% deep and spent roughly four years underwater before the 2025 recovery pulled it out. The sealed basket bottomed at -8%, and its median fallen product was back at its peak within 9 months; the singles groups took 19 and 24 months for the falls they recovered from at all.
If this study changed one belief we held going in, it is this one: a single card and a broad collection of cards are different assets. The gap between them was nearly 48 percentage points of maximum drawdown.
"Vintage is safest" - measured: last place
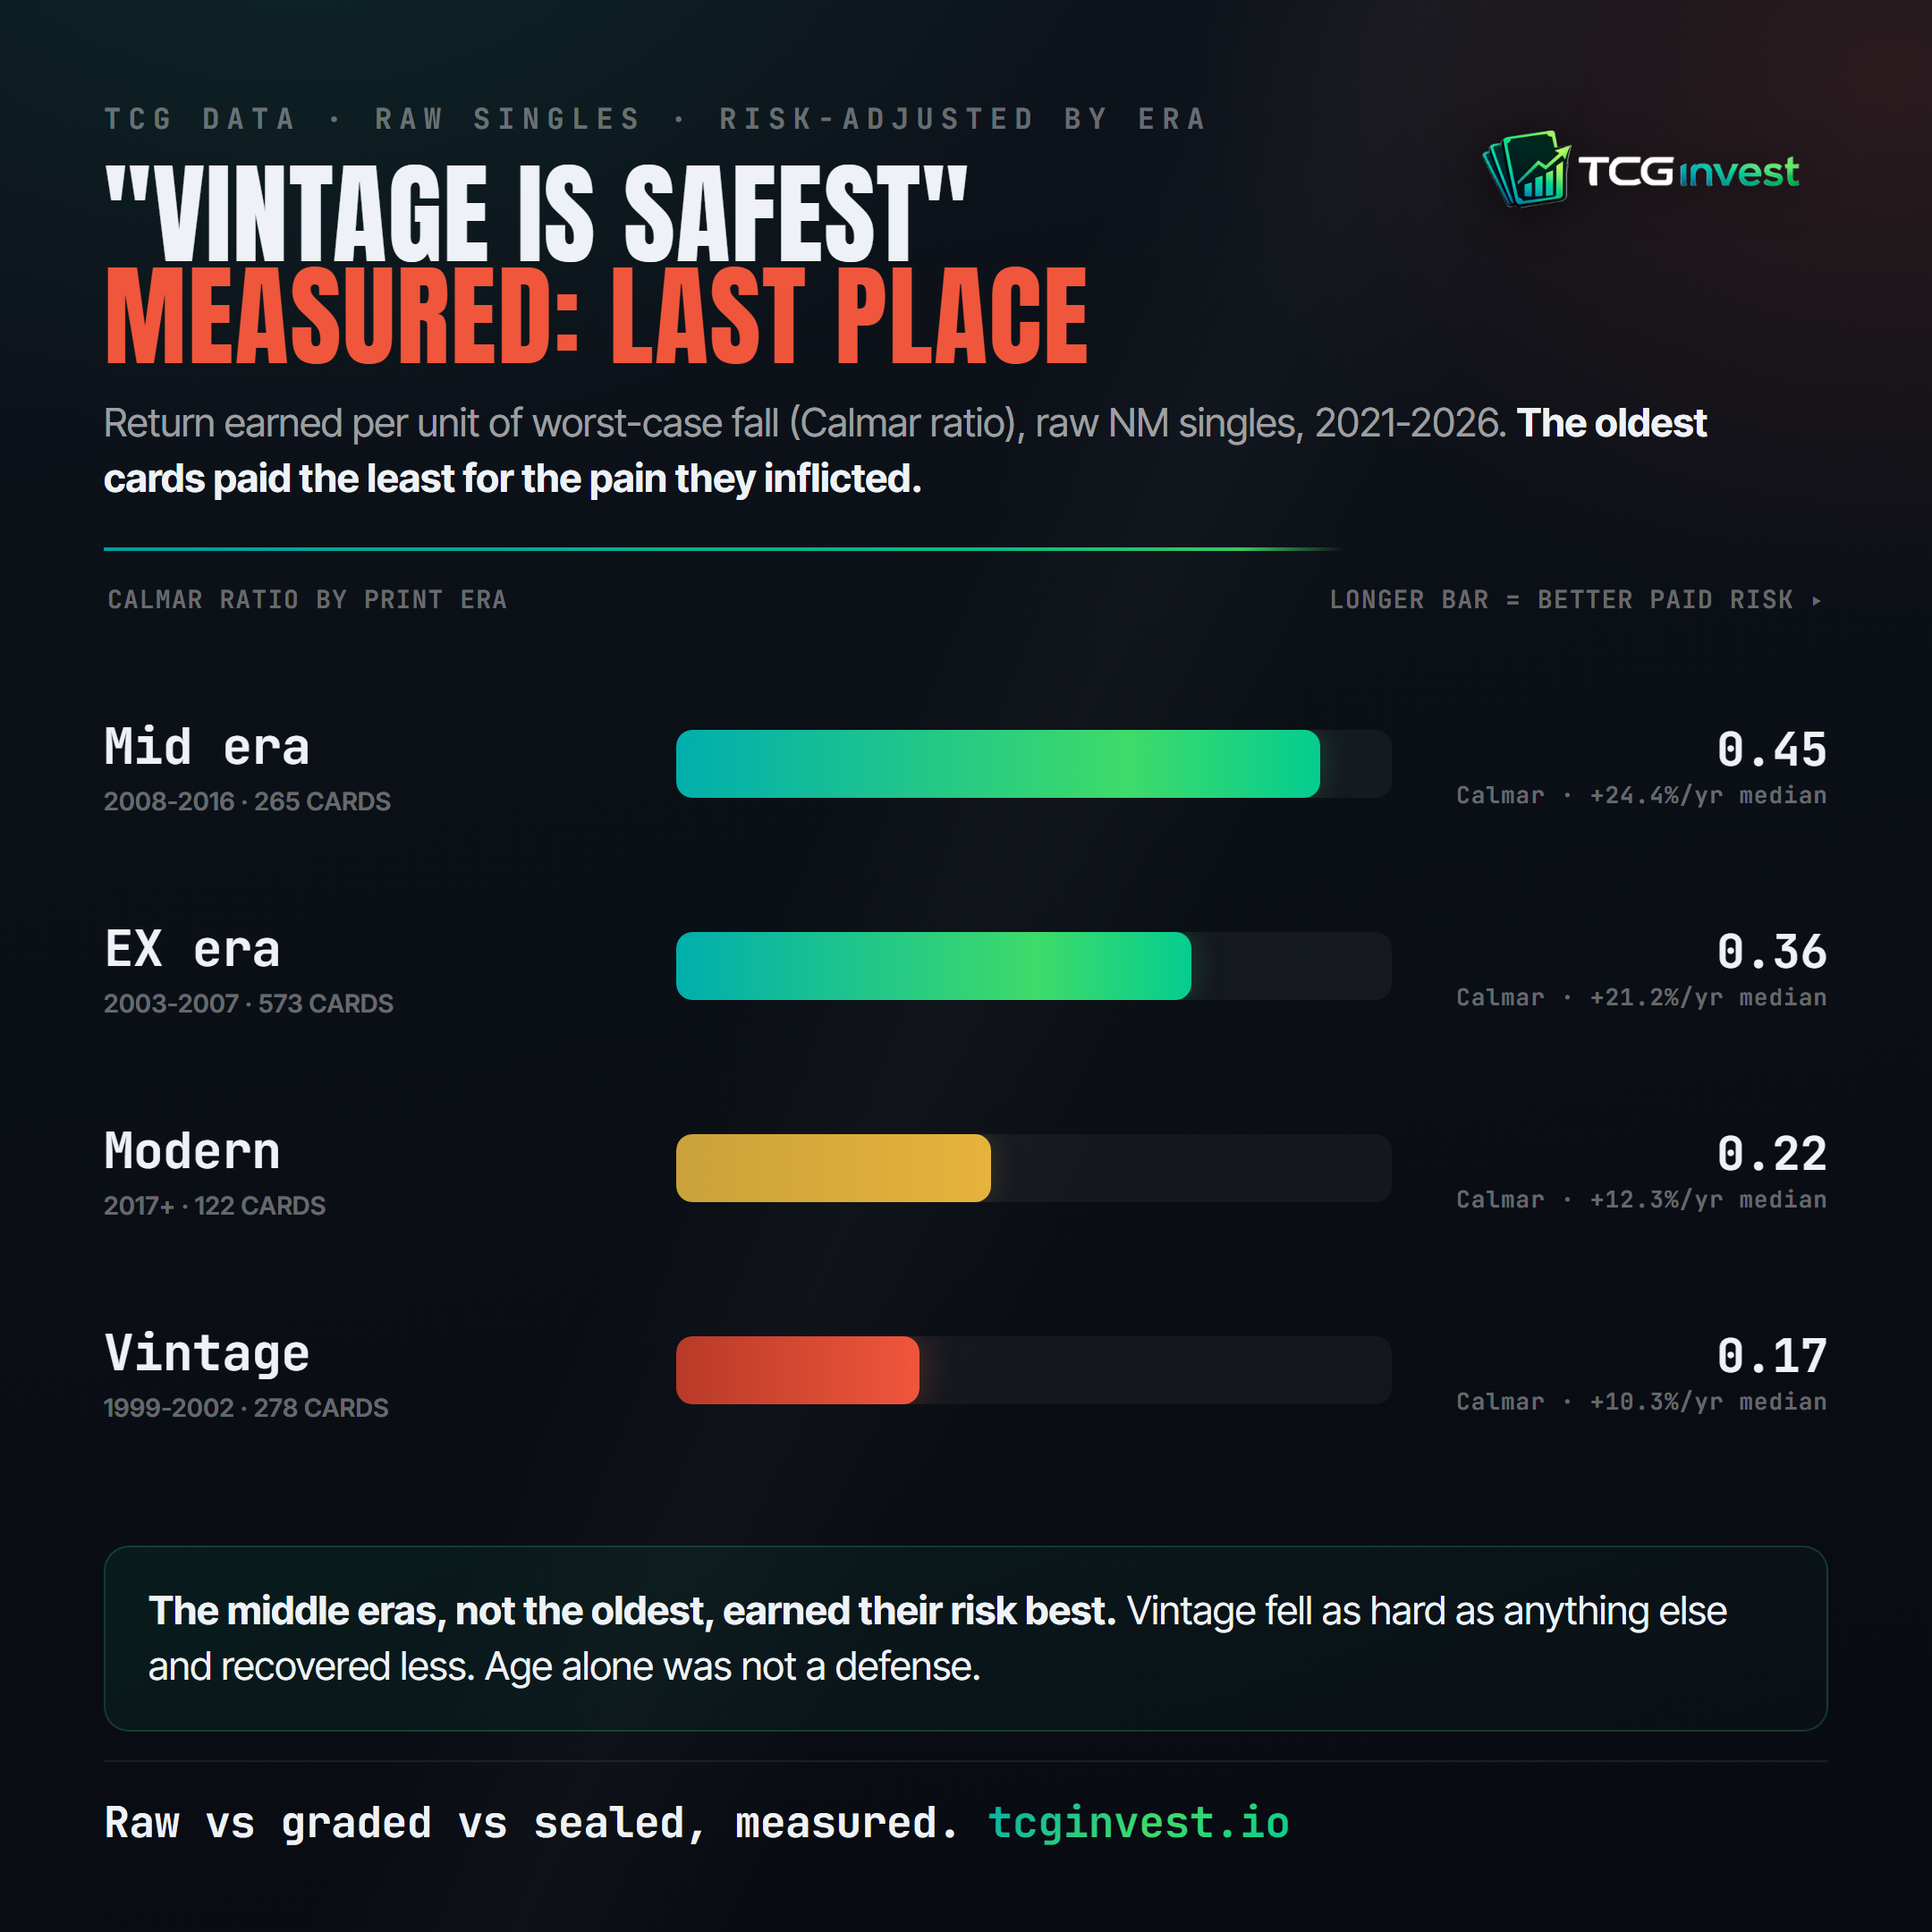
The second surprise. Ranked by return earned per unit of drawdown, raw singles by print era:
| Era (raw singles) | n | Return / yr | Max drawdown | Calmar |
|---|---|---|---|---|
| Mid era (2008-2016) | 265 | +24.4% | -54.2% | 0.45 |
| EX era (2003-2007) | 573 | +21.2% | -62.6% | 0.36 |
| Modern (2017+) | 122 | +12.3% | -56.3% | 0.22 |
| Vintage (1999-2002) | 278 | +10.3% | -62.0% | 0.17 |
Vintage cards suffered some of the deepest drawdowns while producing the weakest returns, and spent 91% of the window below their highs - the worst underwater share of any era. This is not an artifact of the raw grade band either: the same ranking holds in the PSA 10 group, where Vintage again finishes last (Calmar 0.17) and the middle eras again finish first (Mid era 0.53, on +31.5% per year).
A concrete pair, from the ledger rather than the legend: - the most famous card in the hobby - returned +5.0% per year raw over the window with a -67% drawdown along the way. returned +13.1% per year and still spent time 82% below its peak. In this dataset, being the hobby's biggest name was not linked to holding value better.
Character and scarcity: the folklore keeps losing
By franchise, among raw investment-grade cards with at least 20 qualifying cards:
| Character | n | Return / yr | Calmar |
|---|---|---|---|
| Rayquaza | 25 | +29.1% | 0.45 |
| Mewtwo | 21 | +24.4% | 0.38 |
| Pikachu | 20 | +17.4% | 0.29 |
| Charizard | 30 | +10.7% | 0.19 |
The hobby's most collected character was its weakest holder of value in this universe. One possible explanation is that the most famous names were the most fully priced in 2021, so they had the least room to out-recover the crash.
Scarcity told a similarly uncomfortable story. Splitting the raw group into PSA-population thirds, the middle third (populations between 320 and 931) posted the best return (+20.3% per year) and the best Calmar (0.36); the scarcest third fell hardest (-64.5% median drawdown). In this study, scarcer cards did not consistently produce better returns or smaller drawdowns - a result we did not expect, and one that echoes what our readers with grading experience keep telling us: demand structure beats raw rarity.
Inside sealed: the laggard is the one you'd least expect
Sealed was not uniform. By product type:
| Sealed type | n | Return / yr | Max drawdown | Calmar |
|---|---|---|---|---|
| Blisters | 50 | +34.9% | -20.0% | 1.91 |
| Premium Collections | 26 | +37.3% | -19.1% | 1.78 |
| Booster Boxes | 28 | +34.4% | -20.7% | 1.51 |
| Tins | 51 | +34.9% | -27.4% | 1.26 |
| Booster Packs | 99 | +30.0% | -49.1% | 0.58 |
Single booster packs - the smallest, most tradeable sealed unit - behaved half like singles: nearly 50% median drawdowns and a Calmar closer to raw cards than to boxes. The larger, harder-to-open formats carried the sealed advantage. This matches what our separate multi-year backtest found from a different angle: the product-type ordering, with loose packs structurally last, is one of the most persistent patterns in our sealed data.
What this study does not say
Restraint is the price of publishing measurements, so here is the honest boundary of these results:
- It does not say sealed will win the next five years. This window buys at the top of a bubble, crashes, and recovers. That sequence flattered assets that fell least. A different entry point reorders the table.
- Sealed carries a survivorship shadow no filter fully removes. Products with continuous 2021-2026 histories are products the market kept caring about; products that stopped trading regularly cannot contribute to the later returns, which probably makes the sealed results look somewhat better than the entire historical sealed market really did. Read sealed's numbers as the performance of surviving, tracked sealed product - a real but softer claim.
- Raw NM is a wide grade band. A "near mint" sale spans what PSA would call a 6 and what it would call a 10, and the mix drifts with demand. That is exactly why we ran the PSA 10 group as the sharper instrument - and the era and character rankings replicated across both. Where the instruments agree, we trust the pattern.
- On the data source: these are PriceCharting sold-price medians. We chose completed-sale medians deliberately: sales are observable and reproducible where asking prices are not, medians blunt the effect of one unusually high or low sale, and this source carries the most datapoints per card-month of any public one. The trade-off is that aggregates smooth the tails - our volatility and drawdown figures are, if anything, understatements of what individual transactions experienced. The PSA population data behind the scarcity cut comes from PSA's own census of 11 million graded cards.
- Market prices, not investor returns. Nothing here includes fees, shipping, spread, or taxes. Every number would be somewhat worse in practice, and worst for whatever trades thinnest.
Universe: every English Pokemon single passing the site's public investment-grade gates (>=15 tracked sales/180d, >=$20 raw) with a monthly price series covering at least 54 of the 66 months from 2021-01 to 2026-06, starting by 2021-03 and running to at least 2026-04. One print variant per card (the variant with the deepest history) so mixed-variant series cannot fake volatility. Sealed: all physical products meeting the same continuity rule, a $10 floor, and an artifact filter that drops any item showing a single month-over-month move beyond +/-200%. Metrics: returns are monthly sold-price medians; CAGR annualizes first-to-last; volatility is the annualized standard deviation of monthly returns; max drawdown is each asset's own peak-to-trough; Calmar = CAGR / |max drawdown|; Sharpe and Sortino use a zero risk-free rate. Group figures are per-asset medians; basket figures are equal-weight indexes of each asset normalized to its first observation. The full methodology behind our data pipeline is documented here. Every number in this article was computed from the database this site runs on, and the group figures can be sanity-checked against any card page's own history chart.
FAQ
Were sealed Pokemon products a better investment than PSA 10 cards? Over this 2021-2026 window, sealed finished ahead on every measure we ran: +32.8% vs +14.9% median annual return, a -29.7% vs -62.3% median max drawdown, and a Calmar ratio of 1.11 vs 0.24. That is a measurement of one window, not a forecast.
Was sealed safer than raw cards? In this window, yes: the median sealed product fell half as far (-29.7% vs -60.0%) and recovered in 9 months where raw took 19. The exception was loose booster packs, which fell almost 50% and behaved half like singles.
Why did raw Pokemon cards fall 60%? The window contains the 2021-2022 bubble unwinding. The median investment-grade raw card gave back 60% from its own peak before recovering, and vintage plus the scarcest cards fell hardest.
Why did the diversified basket only fall 12%? Individual cards crashed on different schedules, so a basket of all 1,238 raw cards never had all its worst moments at once. It never fell more than 12.2% below its peak while its median member fell 60%.
Why use PriceCharting sold-price data? Completed sales are observable and reproducible where asking prices are not, medians blunt the effect of one unusual sale, and this source carries the most datapoints per card-month of any public one. The trade-off: aggregates smooth the tails, so our risk figures are, if anything, understatements.
Where this leaves a holder
We publish measurements, not instructions, so the closing observations are exactly that:
Over this five-year window, sealed products delivered far more return for the downside they experienced than either raw singles or PSA 10s - and within singles, the middle eras, second-tier franchises and mid-scarcity cards quietly outperformed the trophies the market had already agreed on. The pattern that repeats across our studies is that consensus was expensive: whatever was most famous in 2021 had the least left to give.
The five-year window is one regime. Our deal signals ledger tracks what the same market is doing right now, entry by entry, with outcomes on the record - and the drawdown study covers the risk half of this picture in card-level detail. Between the two, the theme of this article is checkable in public, which is where we prefer our claims to live.