
The stories that get shared are the wins. A card that sold for $5 and now sells for $500. A sealed box that tripled. Those are real, but they answer the wrong question. Real risk is not how high something can go. It is how far it can fall, and how long it stays there.
We measured it using every ungraded Pokémon card with continuous monthly price history across the crash: 1,267 cards, from January 2021 to April 2026. For each one we looked at what actually happened through the deepest drawdown in this dataset. No hypotheticals, no cherry-picked winners. Every card in the set, counted the same way.
We're TCGinvest. We come from quant trading, and this is the kind of test you'd run on a basket of stocks after a crash: how deep was the hole, how long did it last, and did every part of the market fall the same way. Every number here was computed from our database, and the method is documented in full. This is the same downturn the last recovery study looked at from the other side: that one asked what came back, this one asks how far everything fell first.
How Far Did Pokémon Card Prices Fall?
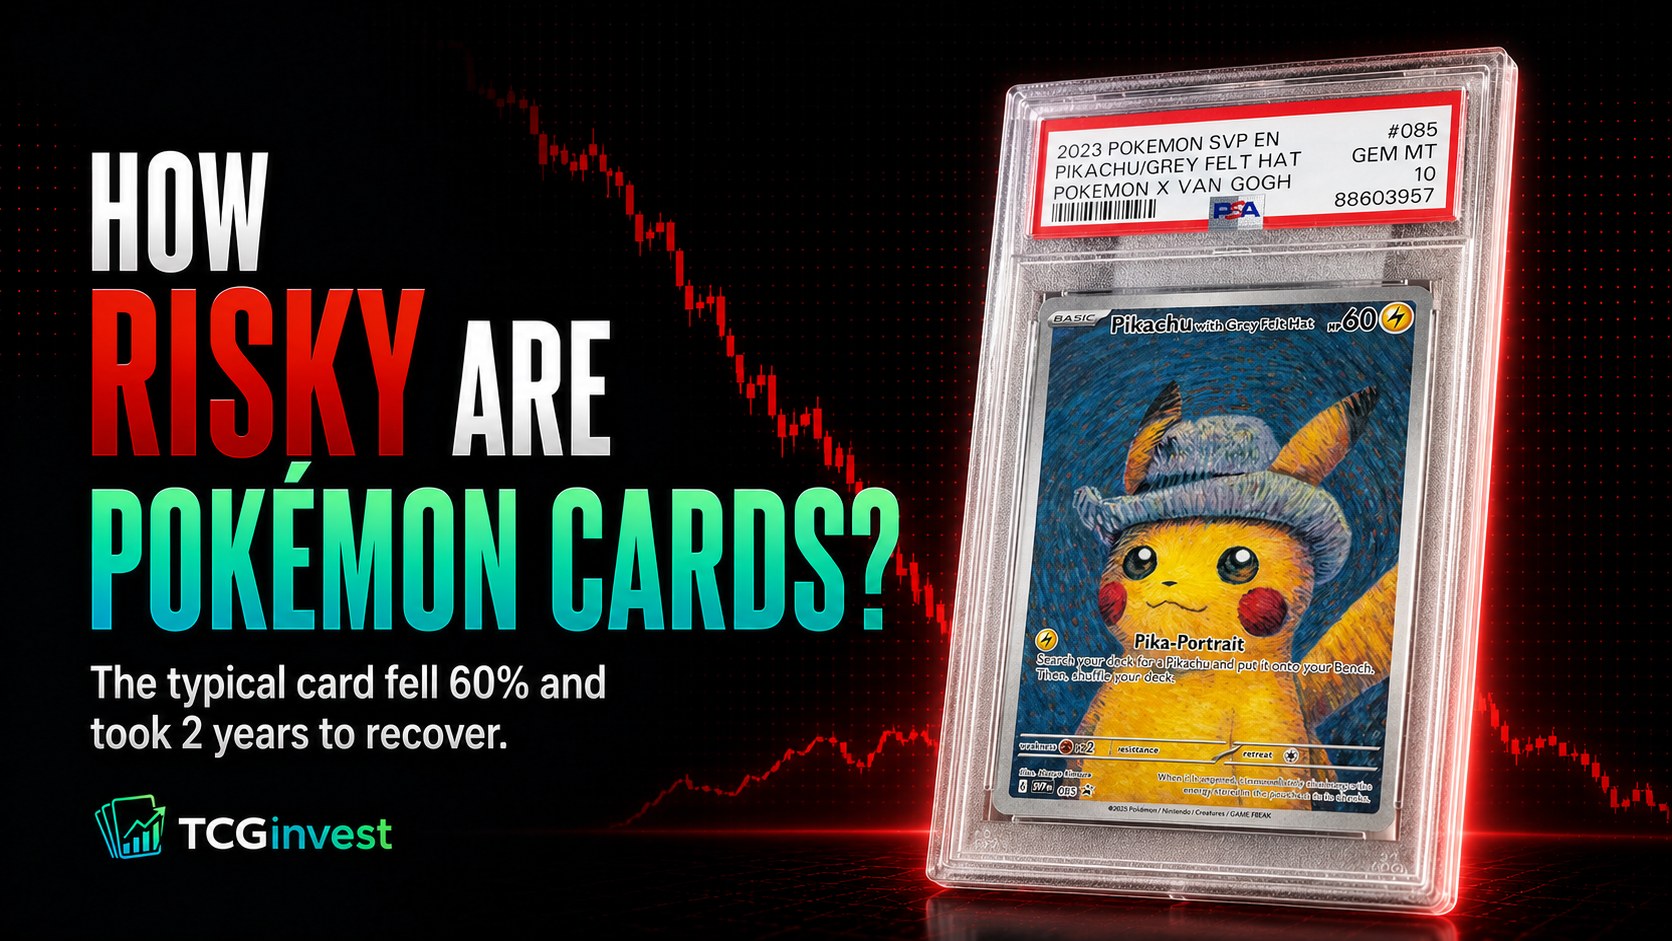
Measured from each card's own high to its own low, the median card fell 60%. Not the worst card. The middle one.
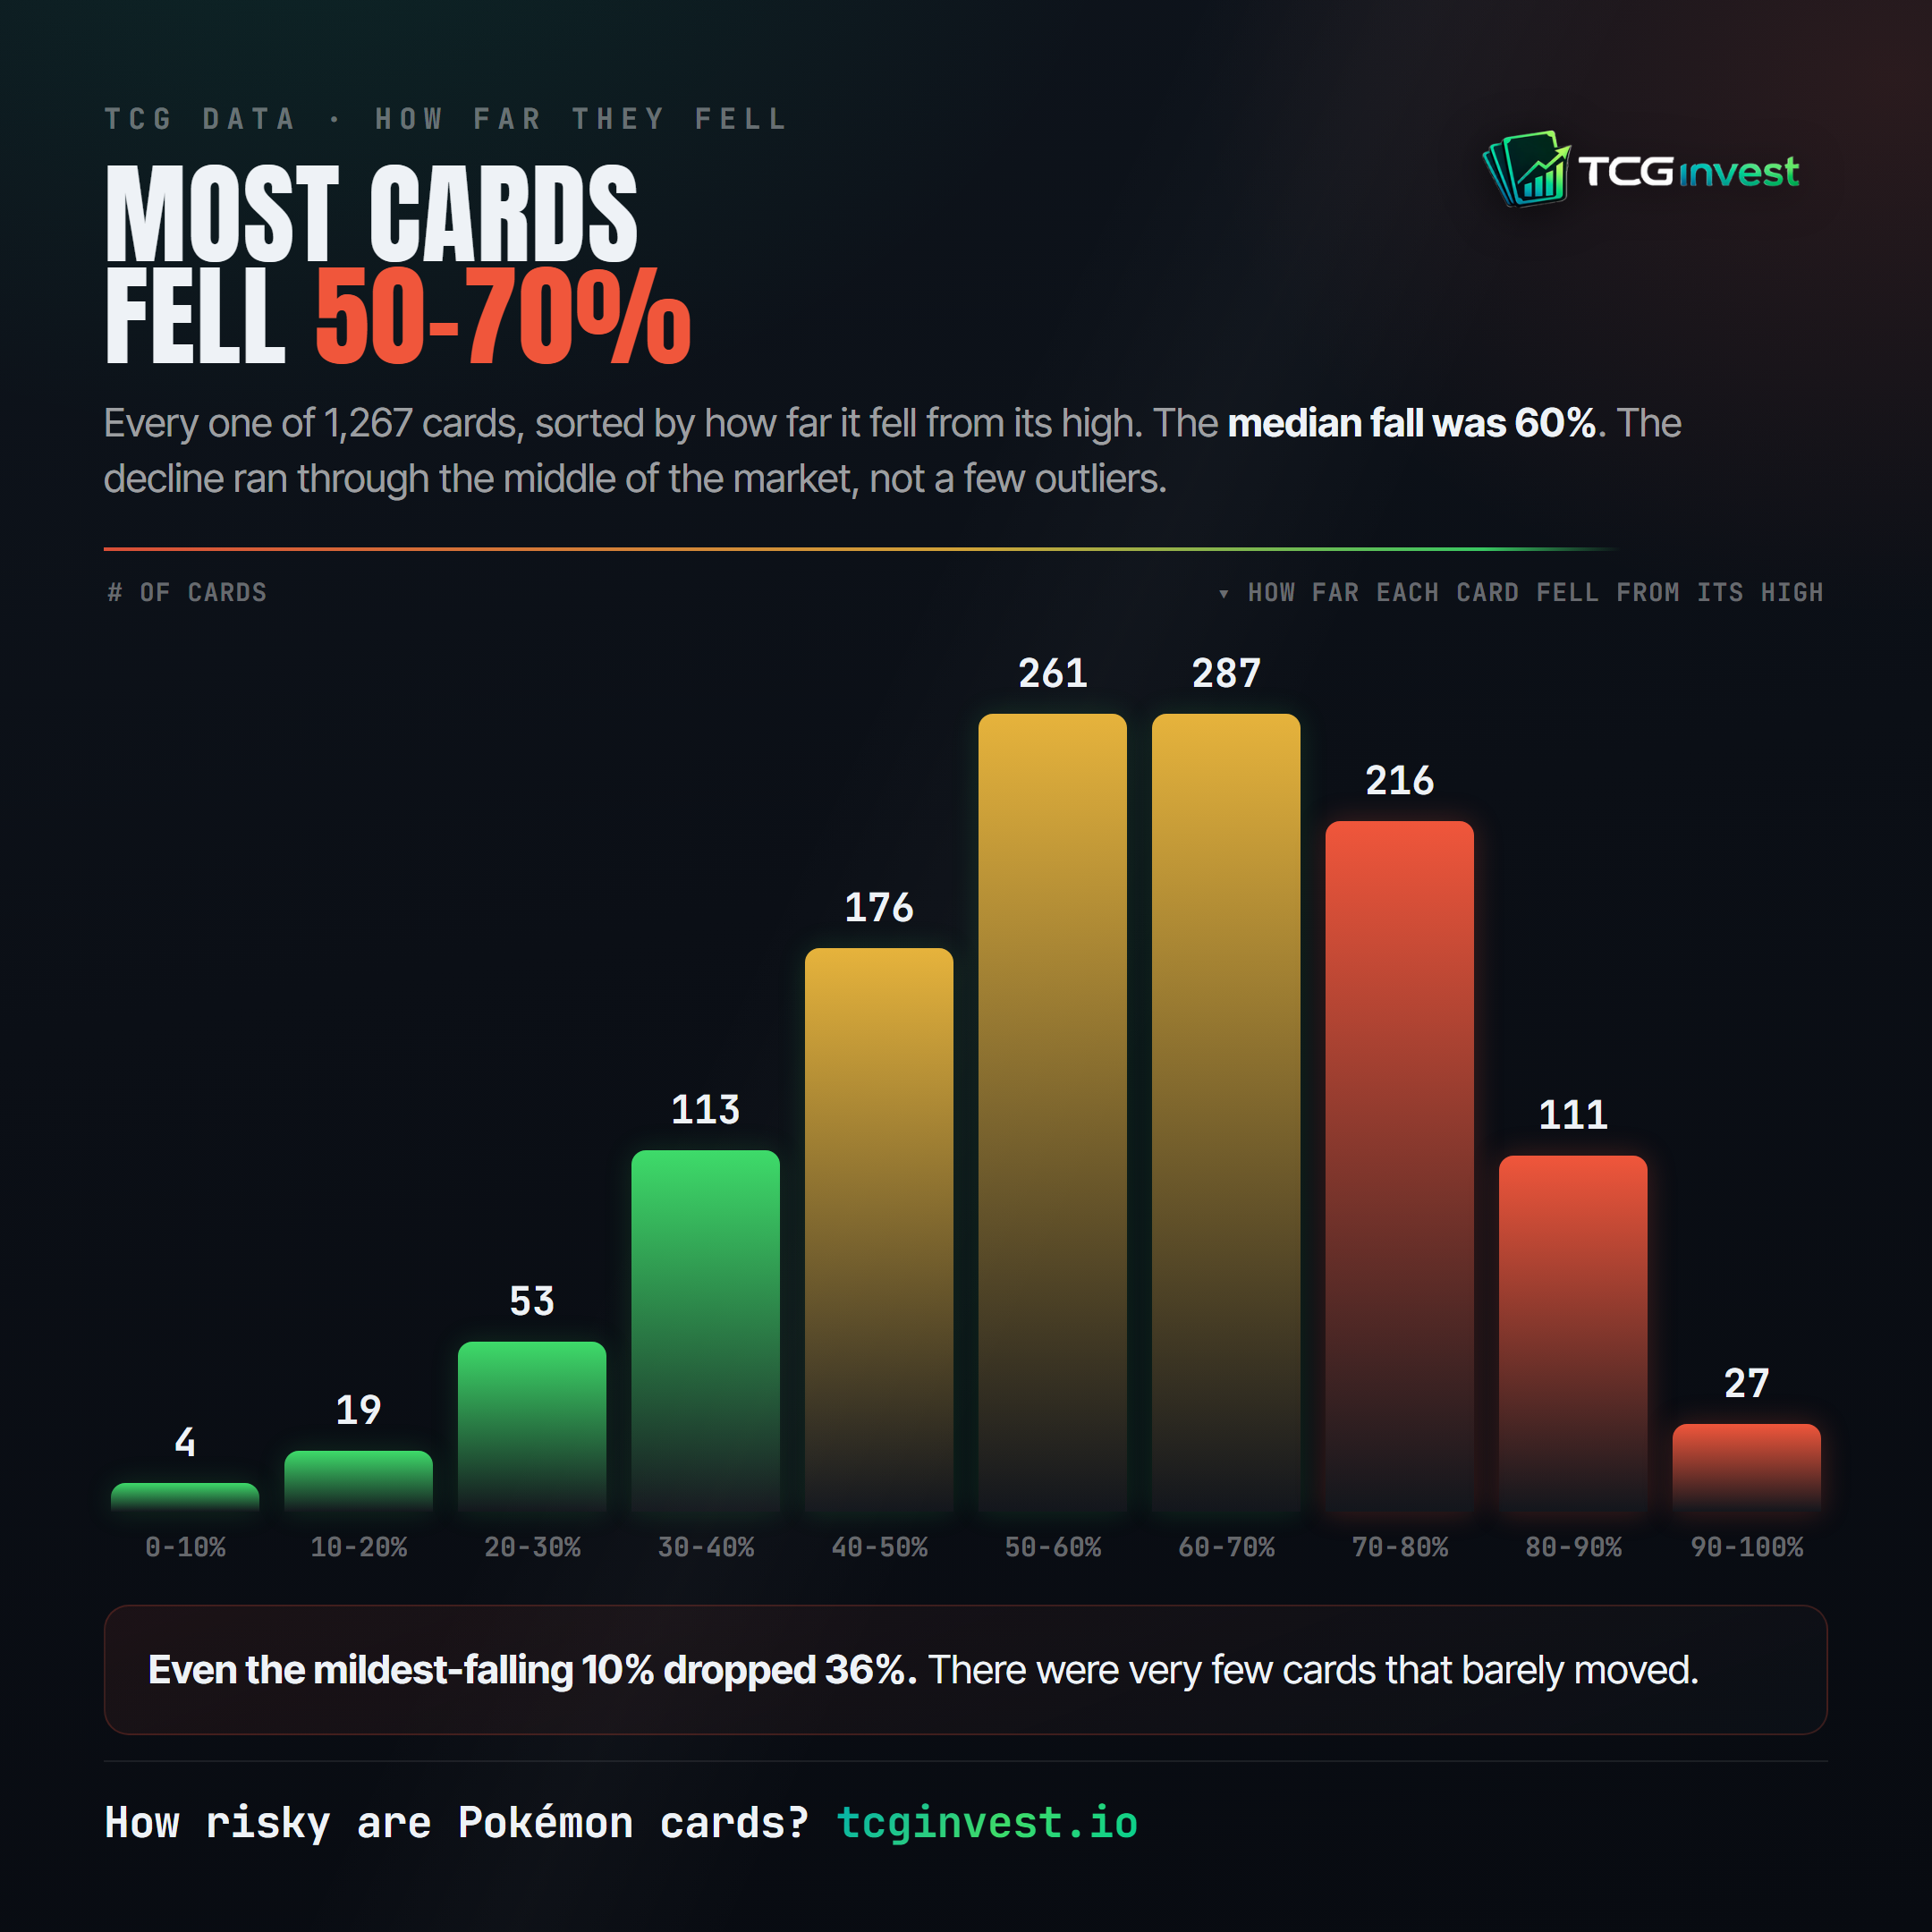
This wasn't a handful of collapsing cards dragging the average down. The decline ran through the middle of the market. The largest concentration of cards fell between 50–70%, with the typical card down 60%, and the falls kept going from there. Even the most resilient tenth of cards still experienced substantial drawdowns, dropping about 36% from their high. If you owned ungraded cards through 2022, the odds are your cards did roughly what this chart shows.
Discussions of long-term returns often focus on the upside. The same market also produced a median 60% drawdown during this period.
It stayed down for years, not months
A crash that lasts three months is one kind of risk. A crash that lasts several years is another. This one was the second kind.
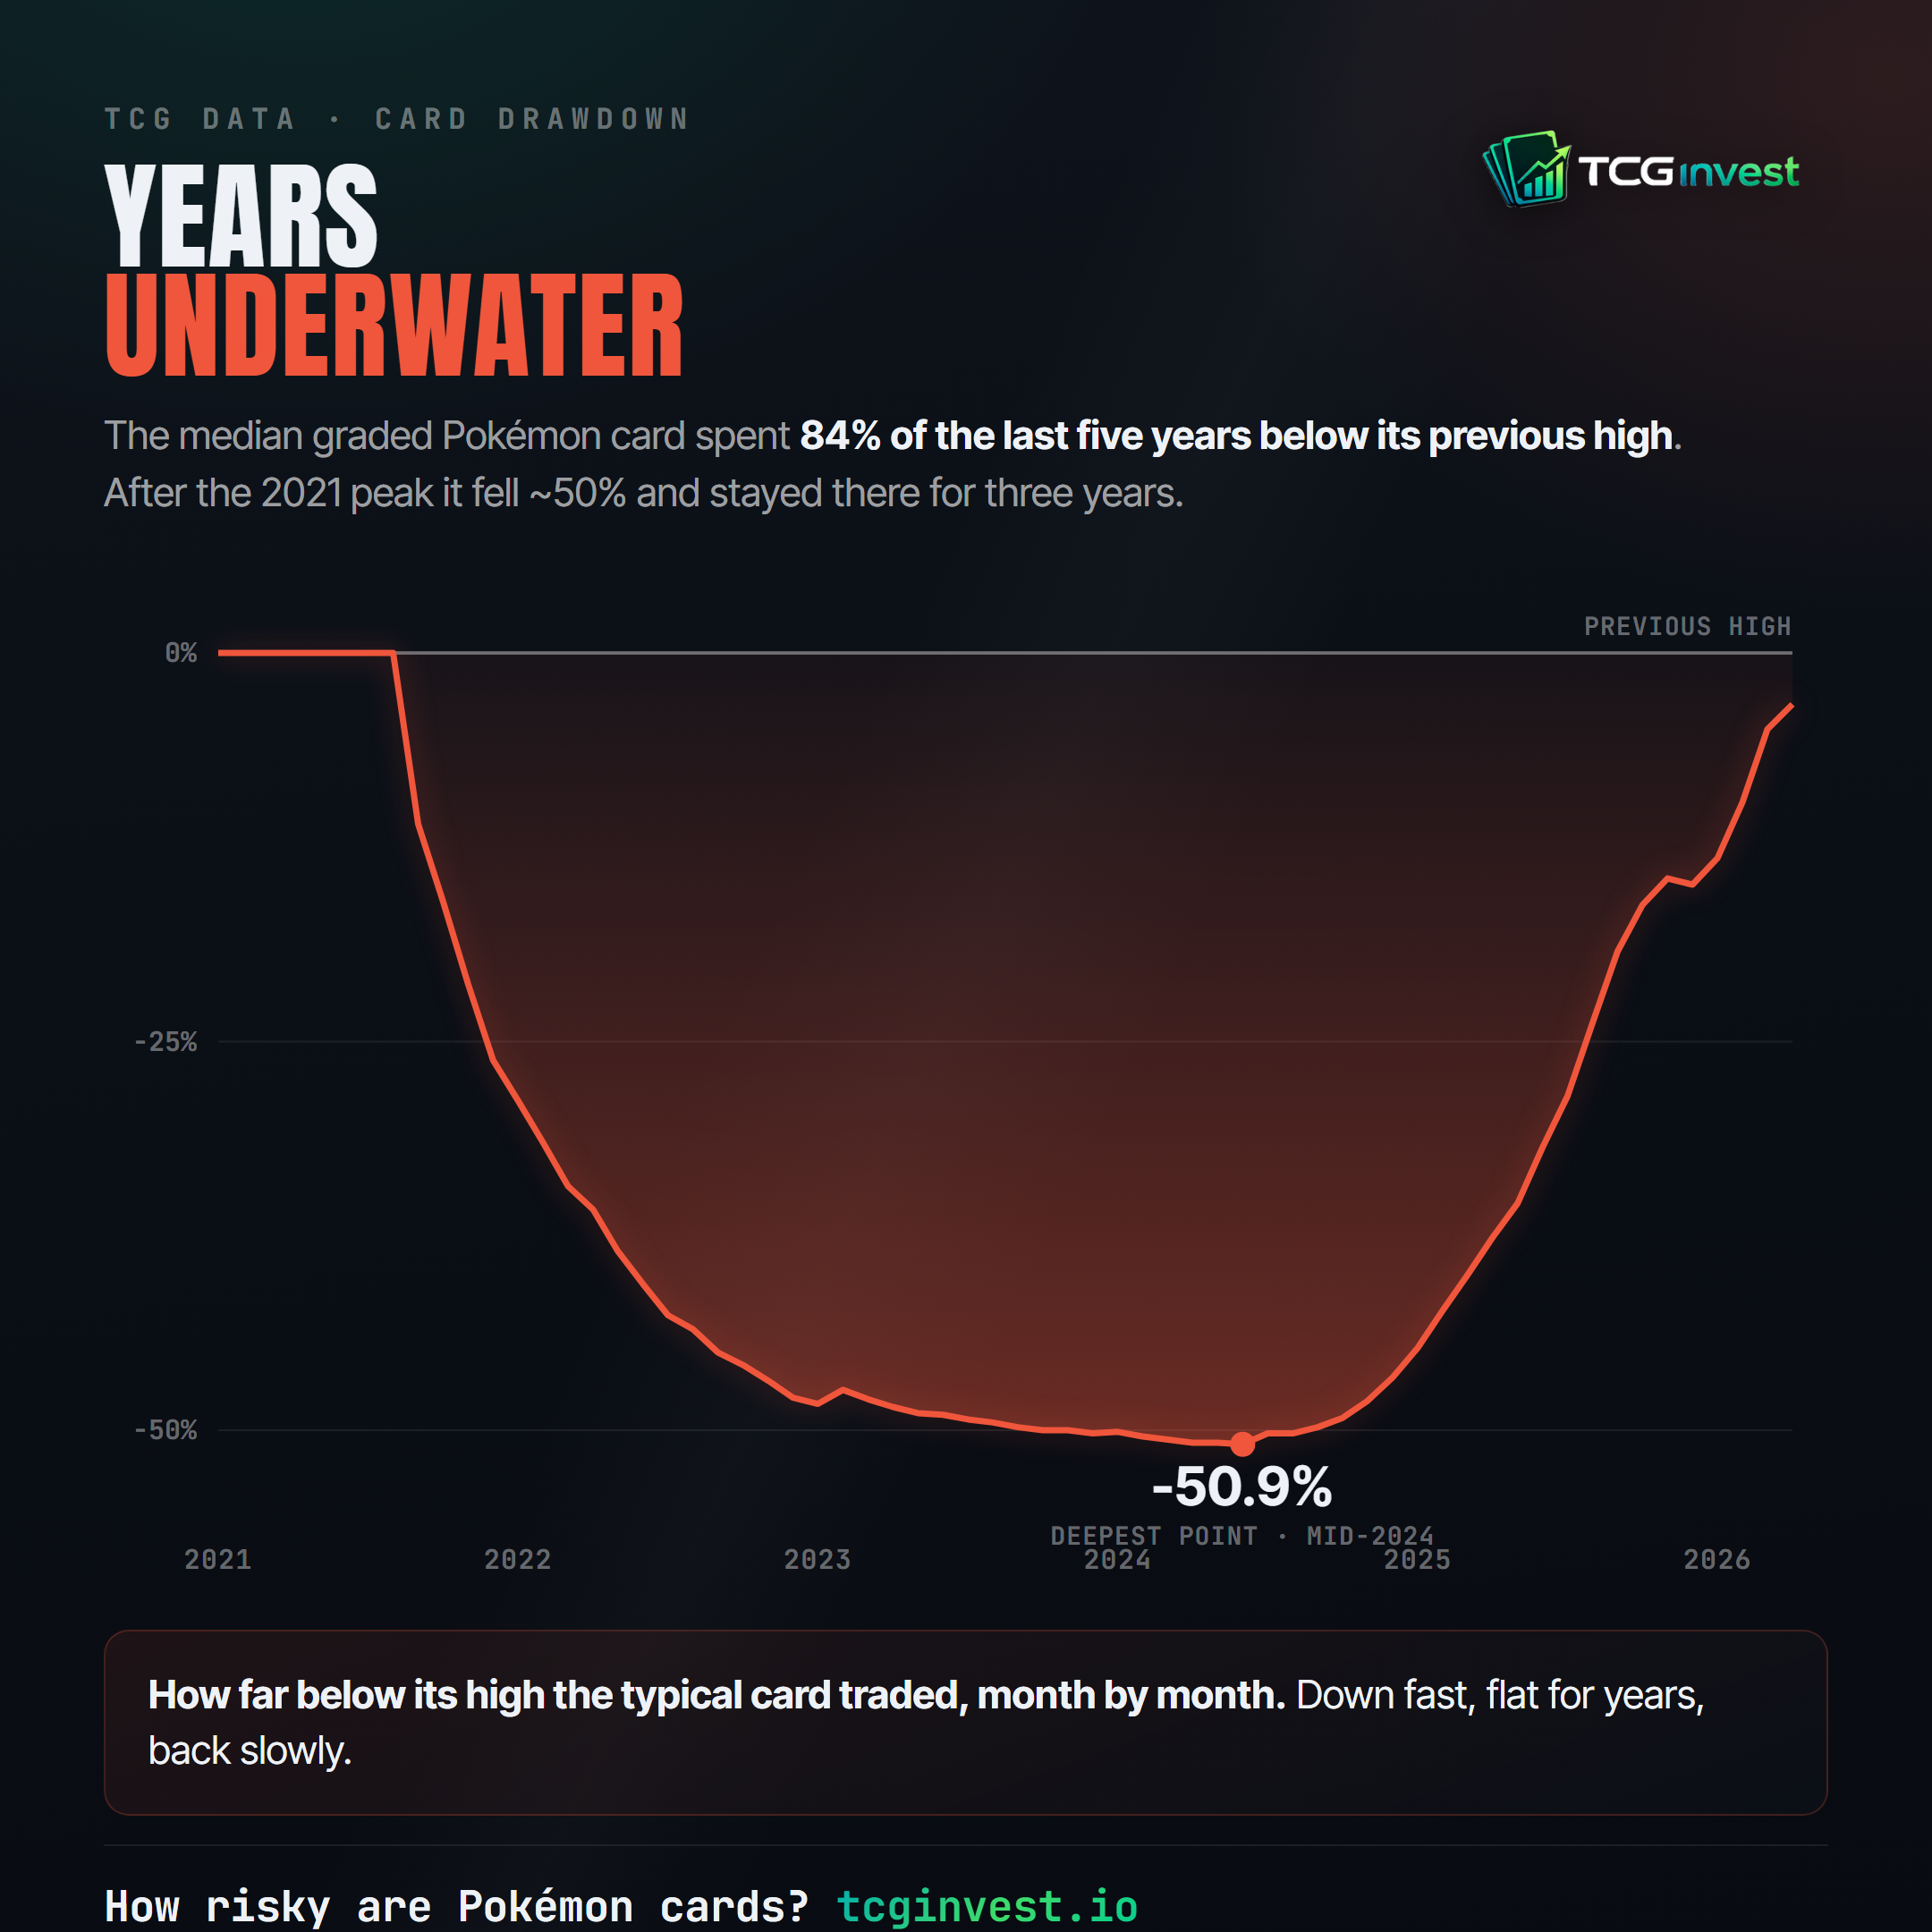
After the 2021 peak, the median card fell roughly 50% and then stayed there. It ground along near its lows through 2022, 2023, and most of 2024, bottoming near −51% in mid-2024. Across the whole window, the median card spent 84% of the last five years below its previous high.
A note on the two figures, because they measure different things. The 60% earlier is the median of each individual card's own peak-to-trough drawdown. The ~51% here is the lowest monthly point of the median card tracked through time. One is the middle of many individual falls; the other is one line moving month by month. Both are correct, and they are not the same number.
That number captures a different dimension of risk than drawdown alone. It is one thing to know a card can drop 60%. It is another to hold it, underwater, for three years, watching it do nothing while the loss just sits on the screen. That is what the price history looked like through the downturn.
The recovery, when it came, was slow and recent. Only from late 2024 did the median claw back, and by April 2026 the typical card had finally returned to within a few percent of its old high. Five years, round trip.
Not every card fell the same way
The crash did not land evenly. Sort the same 1,267 cards by era and the difference is large.
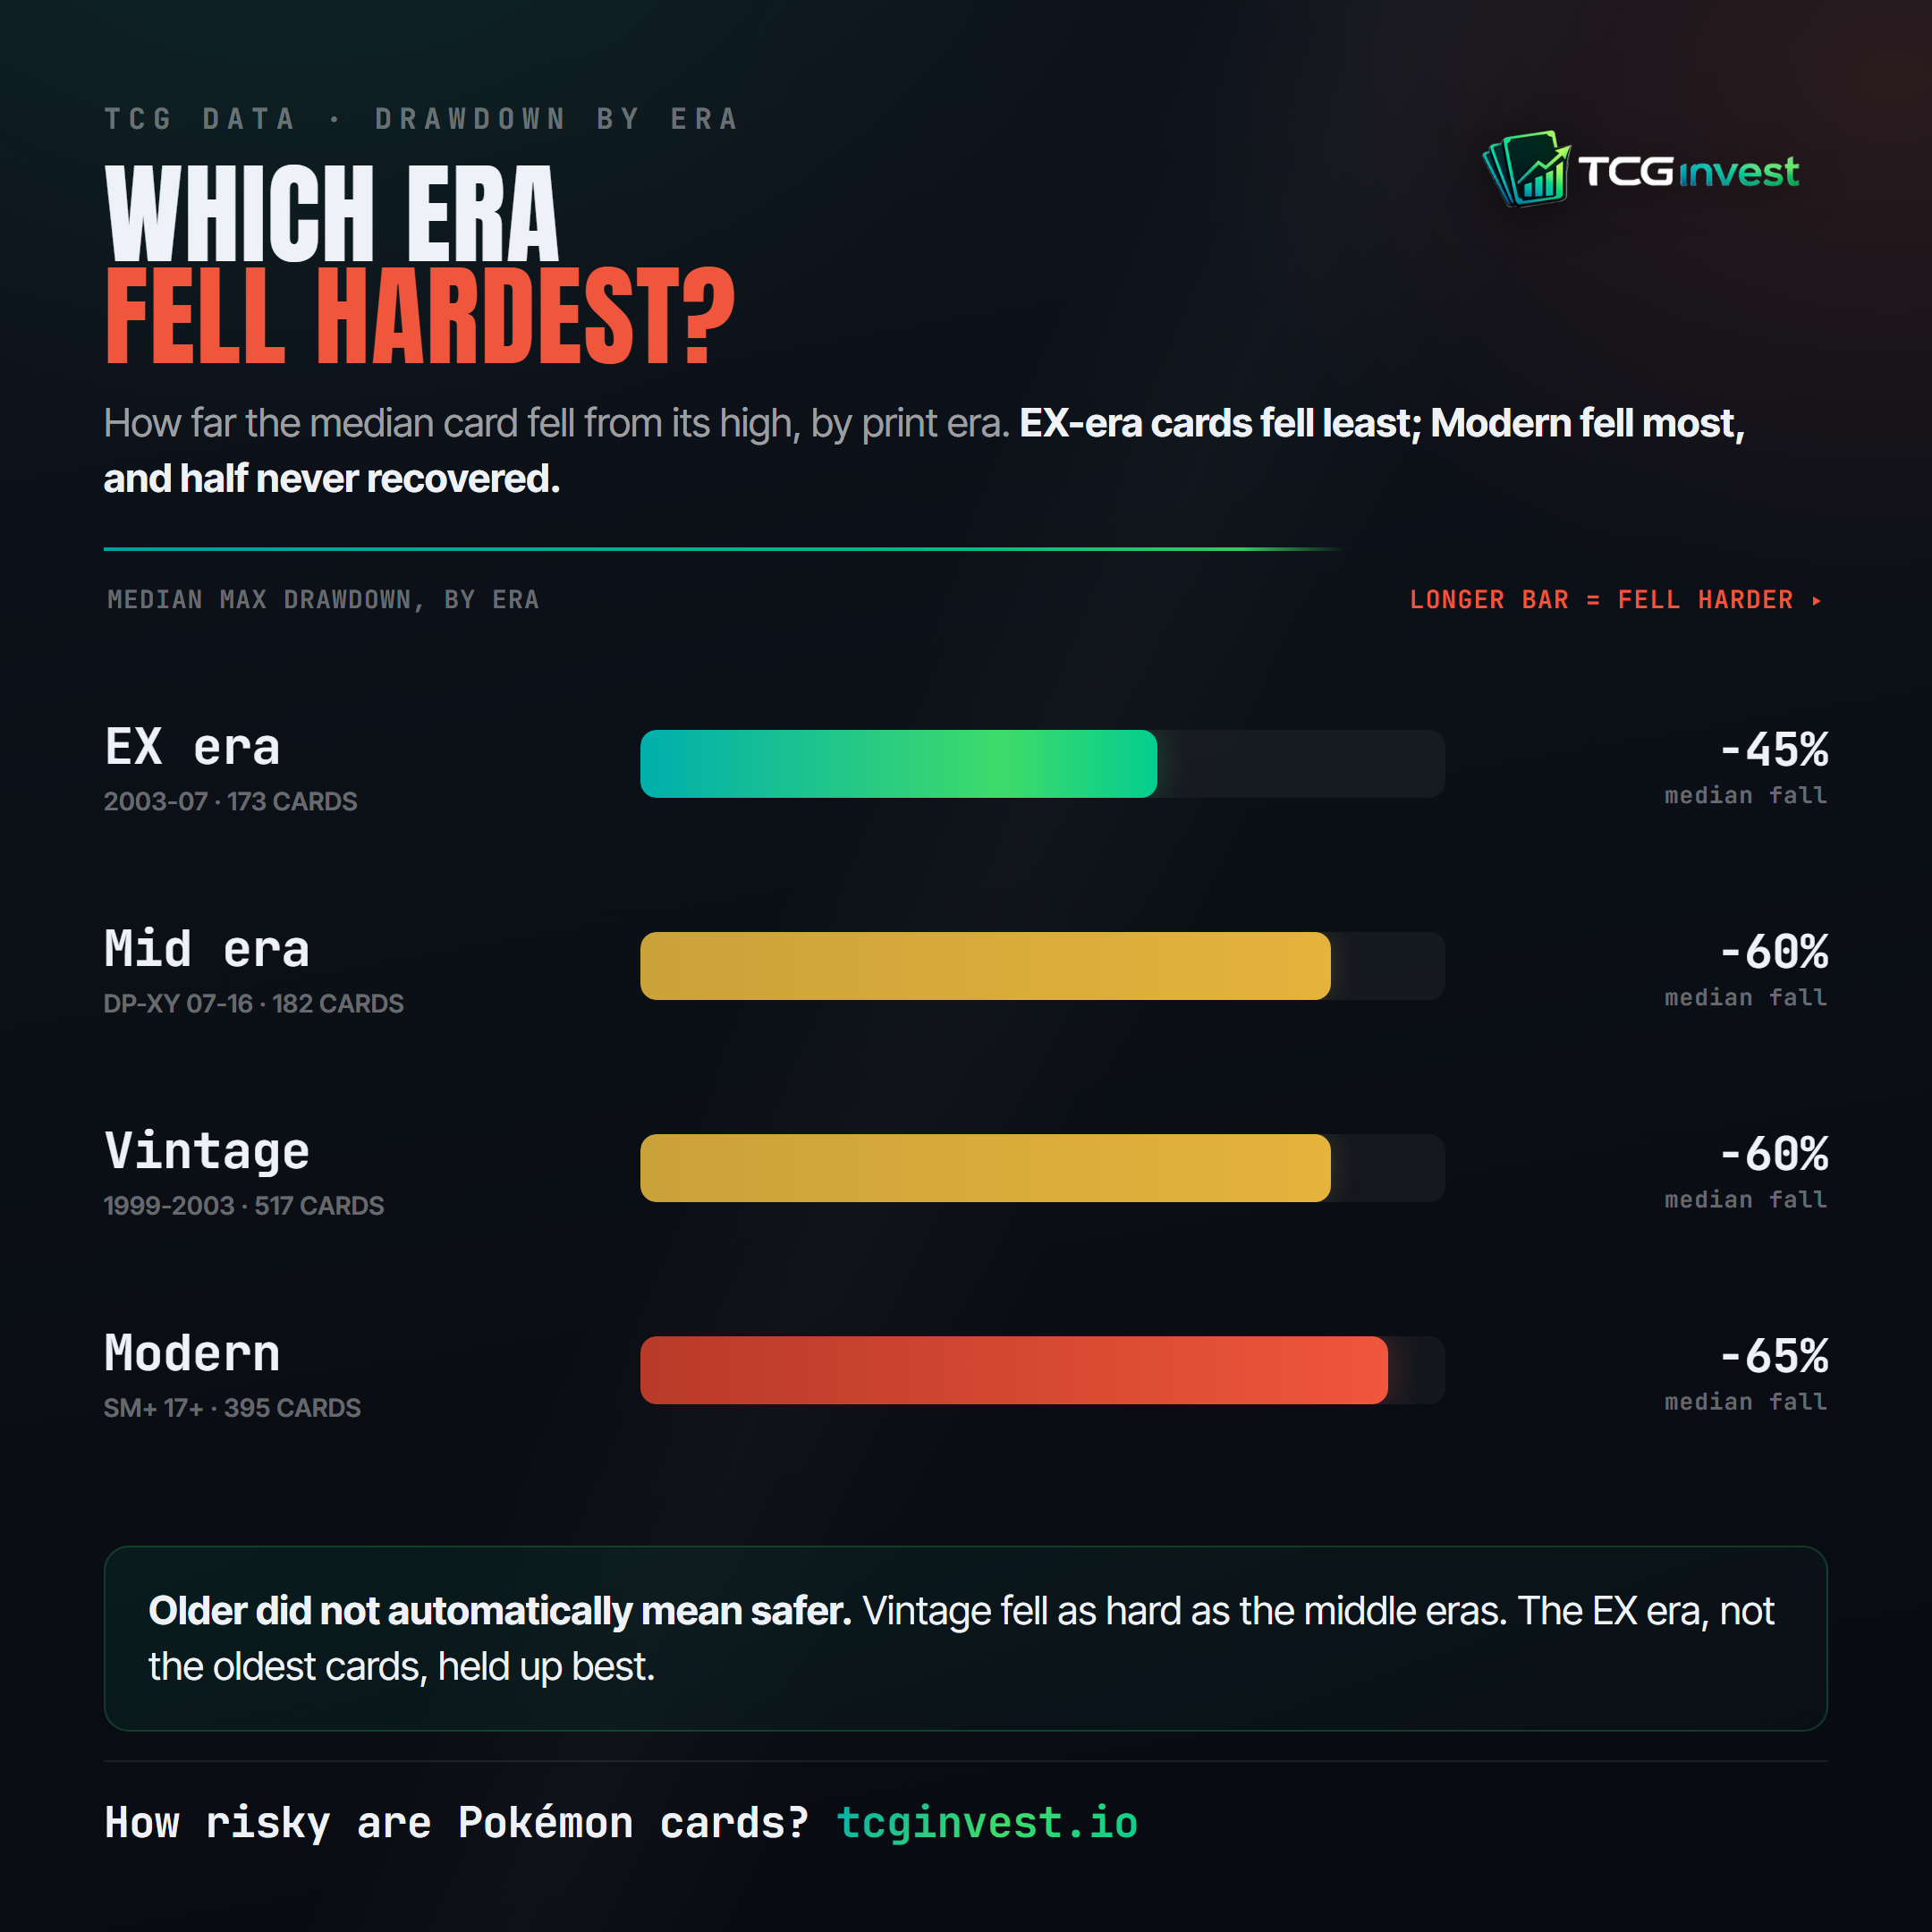
In other words, age mattered. Older eras generally experienced smaller drawdowns, while newer eras absorbed the largest losses.
- EX era (2003–2007) held up best, with a median fall of 45%.
- Vintage (1999–2003) and Mid era (2007–2016) sat in the middle at 60%.
- Modern (2017 onward) fell hardest, a median of 65%.
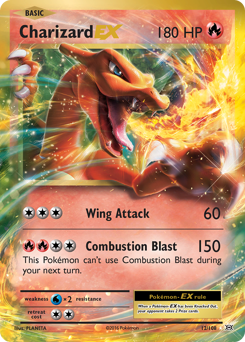
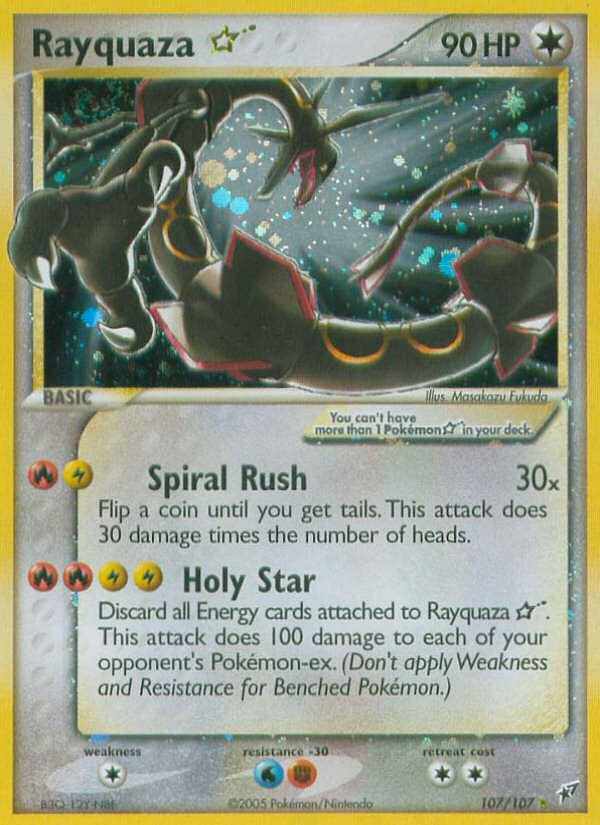
One card from each era, each close to its era's median fall over this window:
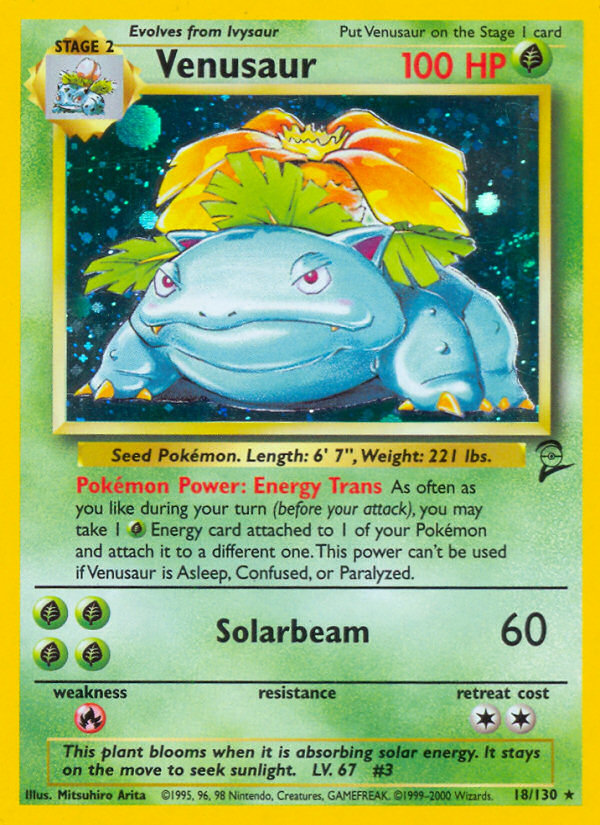
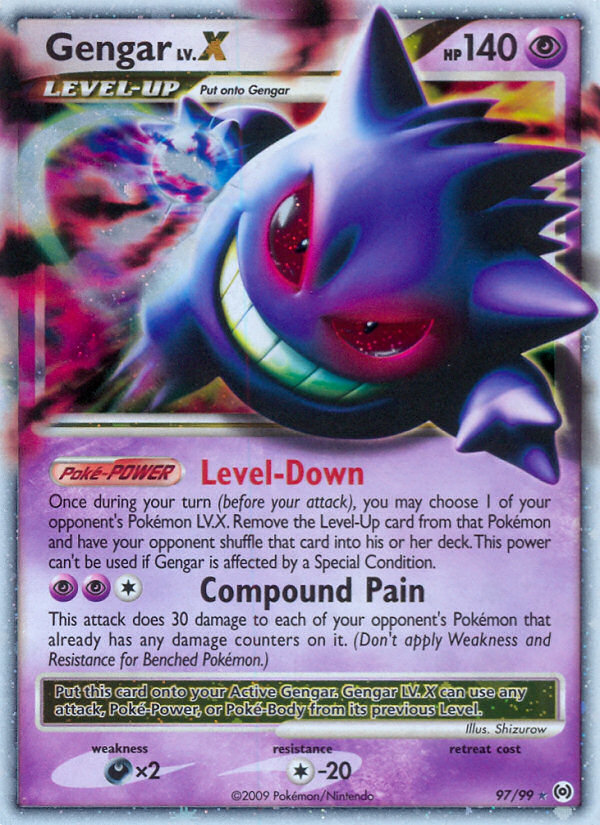
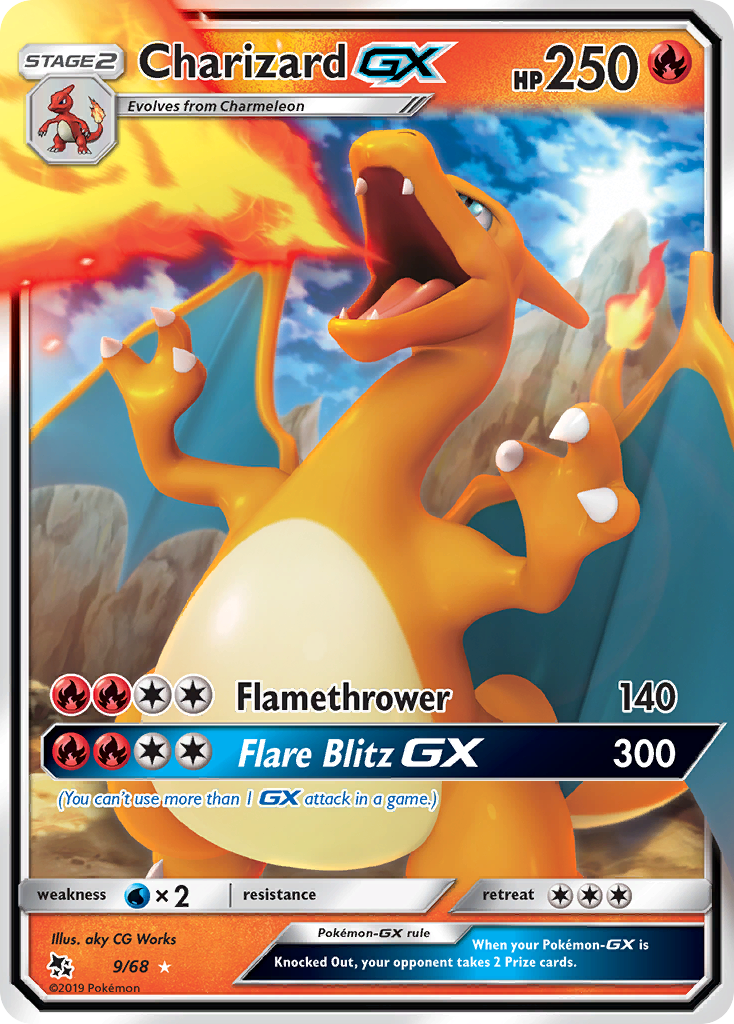
A 20-point spread between the best-holding era and the worst is not noise. Older eras experienced smaller median drawdowns than newer eras in this dataset, while modern cards experienced the deepest falls. The reasons are likely to be multiple, but the difference in outcomes is clear.
The same downturn produced very different outcomes across eras.
Are Pokémon Cards a Risky Investment?
Risky enough that the honest answer is not "they always go up." On this evidence, an ungraded Pokémon card is an asset that can fall 60% from its high, stay underwater for the better part of three years, and take five years to make you whole again.
The more useful finding is the second one. The drawdowns were not evenly distributed across the market, and that unevenness is what makes card-level analysis interesting. A 20-point gap between the best-holding era and the worst is the difference between a fall you recover from and one you sit in. The same downturn was not one risk. It was many, and they landed differently depending on what you held.
This is the question we built TCGinvest to explore. The question is not whether Pokémon cards go up. The last five years show they can rise, and they can fall hard on the way. Across these 1,267 cards from January 2021 to April 2026, the more useful question is which cards consistently showed smaller drawdowns, the ones that have managed risk better than others, and card-level history is where those differences become visible. You can see how the current best-holding cards score today, and read the companion study on what recovered from this same crash.
Methodology: we built this analysis from PriceCharting price data, and every figure here was calculated by us from that dataset and is reproducible using the method described. Drawdowns are measured per card from each card's own peak to its own trough over January 2021 to April 2026, using monthly ungraded ("Near Mint" condition) price history from PriceCharting. The set is the 1,267 cards with continuous history across the full window. "Median card" refers to the middle card in the relevant group, not an index or an average. Figures describe this dataset over this period and are not a forecast.