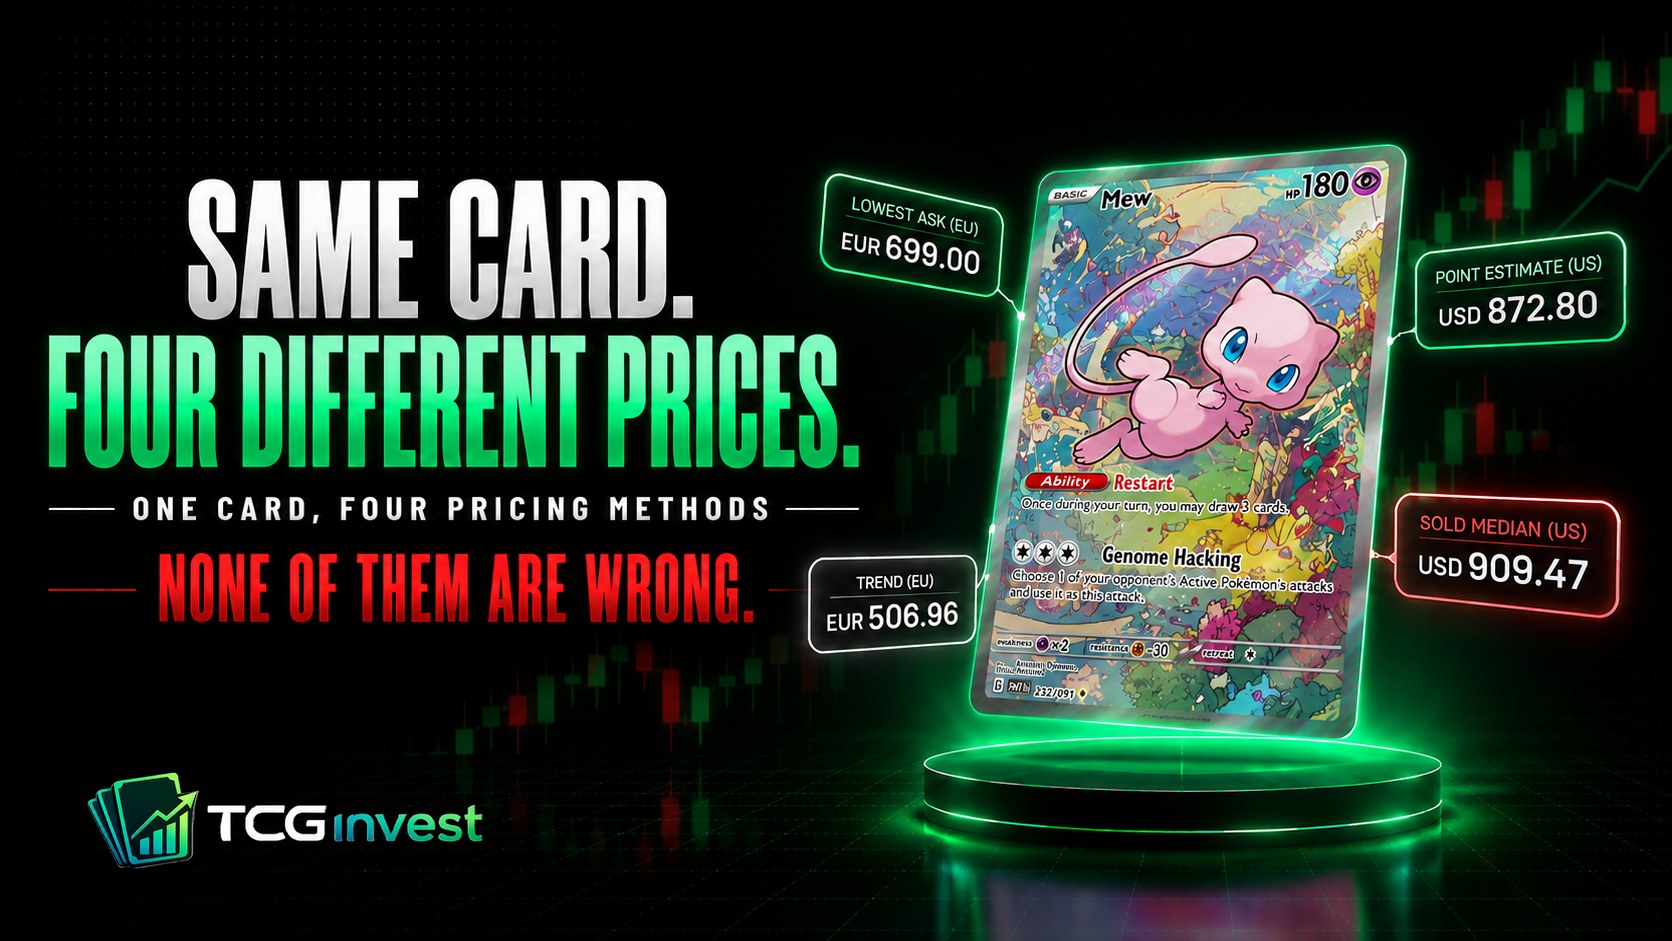
You look up a Pokémon card on one site and it says €700. Another says $806. A third says $900. Same card, same condition, same day. One of them must be wrong.
None of them are wrong. They are answering four different questions, and most tools do not tell you which one you are reading.
Two Pokémon price sites can disagree even when both are accurate. They may be measuring different markets, different kinds of prices, or different sets of sales.
The four numbers
Every price you see on a Pokémon card is one of these:
1. The lowest current ask. What the cheapest seller is asking right now. Nobody has paid it. It is an offer, not a transaction. This is what Cardmarket's big number shows you, and what most "price check" tools scrape.
2. A rolling average of asks. Cardmarket's trend line is built from listings over a recent window. It is smoother than the lowest ask, and it lags.
3. A modelled estimate. One modelled estimate of the current price. PriceCharting publishes this. It blends recent sales into a single figure.
4. The median of completed sales. What people actually paid over a recent window. Very high and very low sales have less influence on the result. This is the only one of the four that describes money changing hands.
A site that shows you a €700 lowest ask and a site that shows you a $900 sold median are not contradicting each other. One is telling you what a seller wants; the other is telling you what buyers paid.
Most Pokémon price sites display a single price. That price is usually not labelled as an asking price, a trend, a modelled estimate or a completed sale. We keep the European and US sources separate and label every figure by both its source and its method.
What that looks like on real Pokémon cards
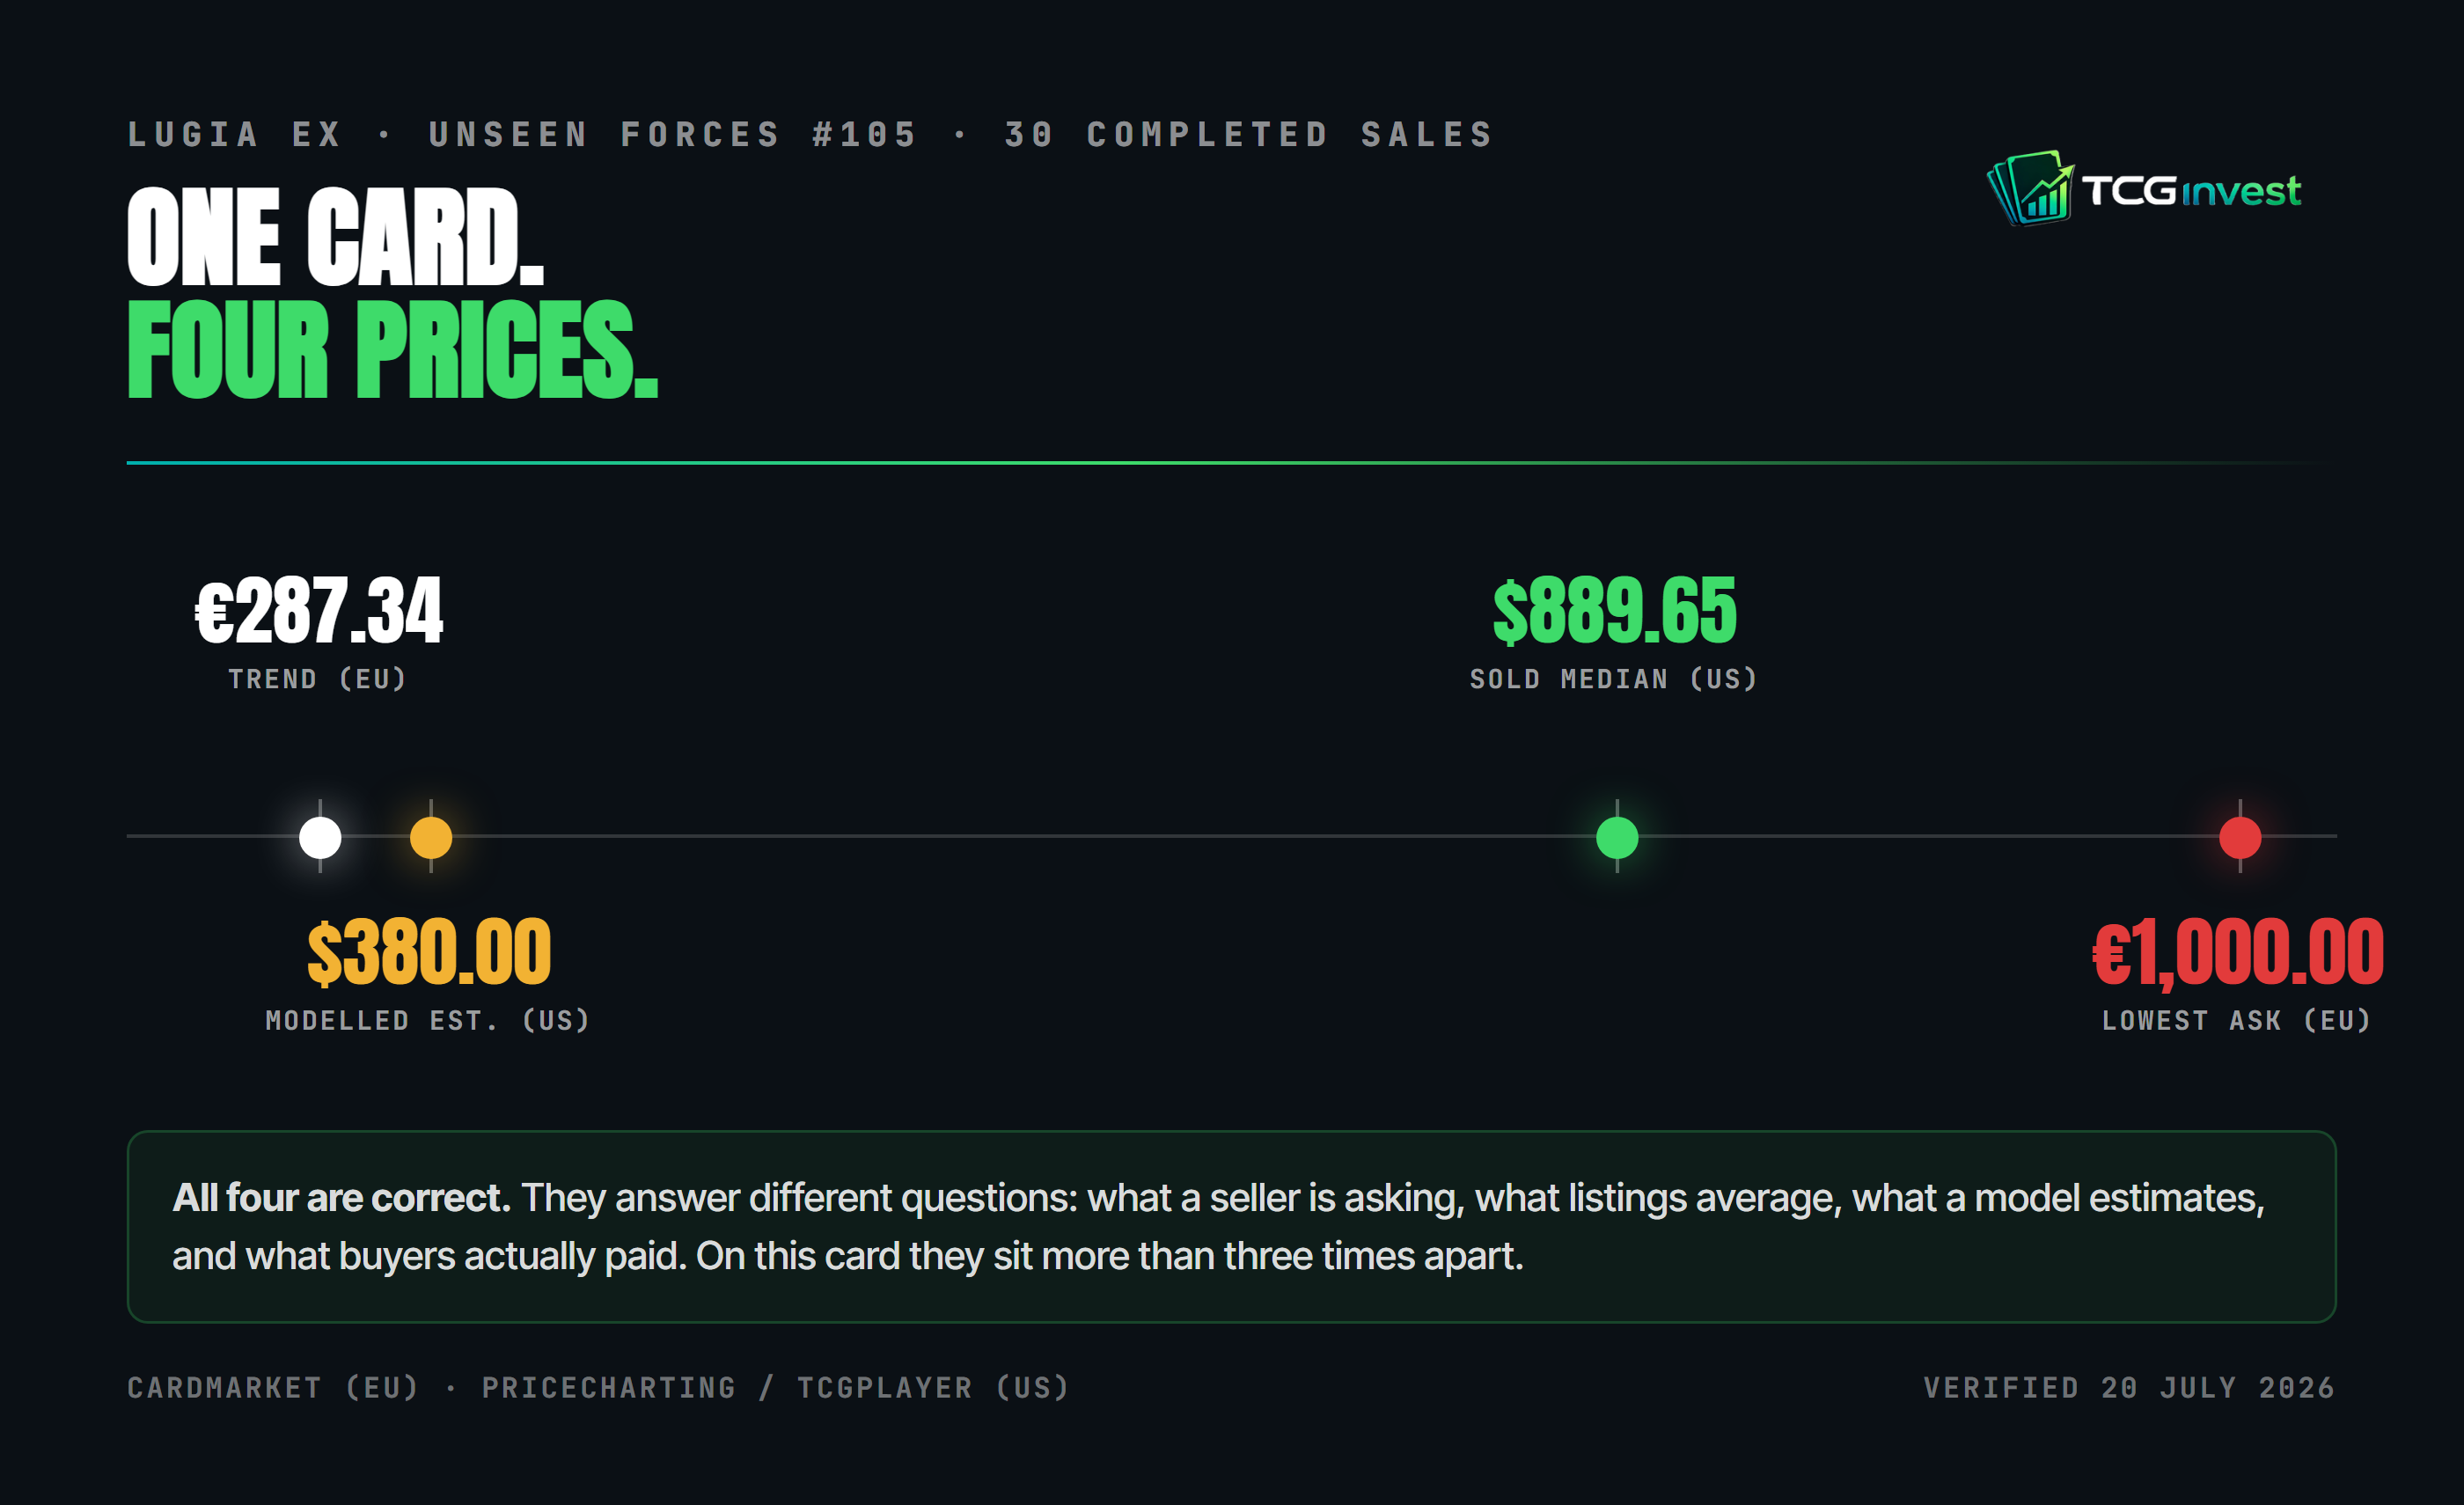
One card. Four prices. All four are correct, and they are more than three times apart. The two European figures are placed on the dollar scale at 1.1573 so all four can be compared on one axis.
Here are five Pokémon cards from our database, each with all four numbers side by side.
Lowest ask means the cheapest Near Mint English copy listed on Cardmarket, not the cheapest copy of any condition or language. Every definition we use is documented in our methodology.
Read the Umbreon row and the numbers broadly agree. Read the Lugia row and they disagree by more than three times.
Those five rows show that different methods can produce different answers, even before you compare different markets.
Why some Pokémon cards agree and others do not
Umbreon VMAX sells constantly. Sixty completed sales in the window we measure. When a card trades that often, every method converges, because they are all describing the same busy market. The ask sits close to the sold price because a seller who prices too high simply watches someone else's copy sell.
Lugia ex from Unseen Forces barely trades. Thirty sales, on a card printed in 2005. In a market that thin, the lowest ask is one optimistic seller, the trend line is dragged down by older cheaper listings, and the sold median sits somewhere in between. Nothing is broken. With fewer sales, each listing and each transaction has a bigger effect.
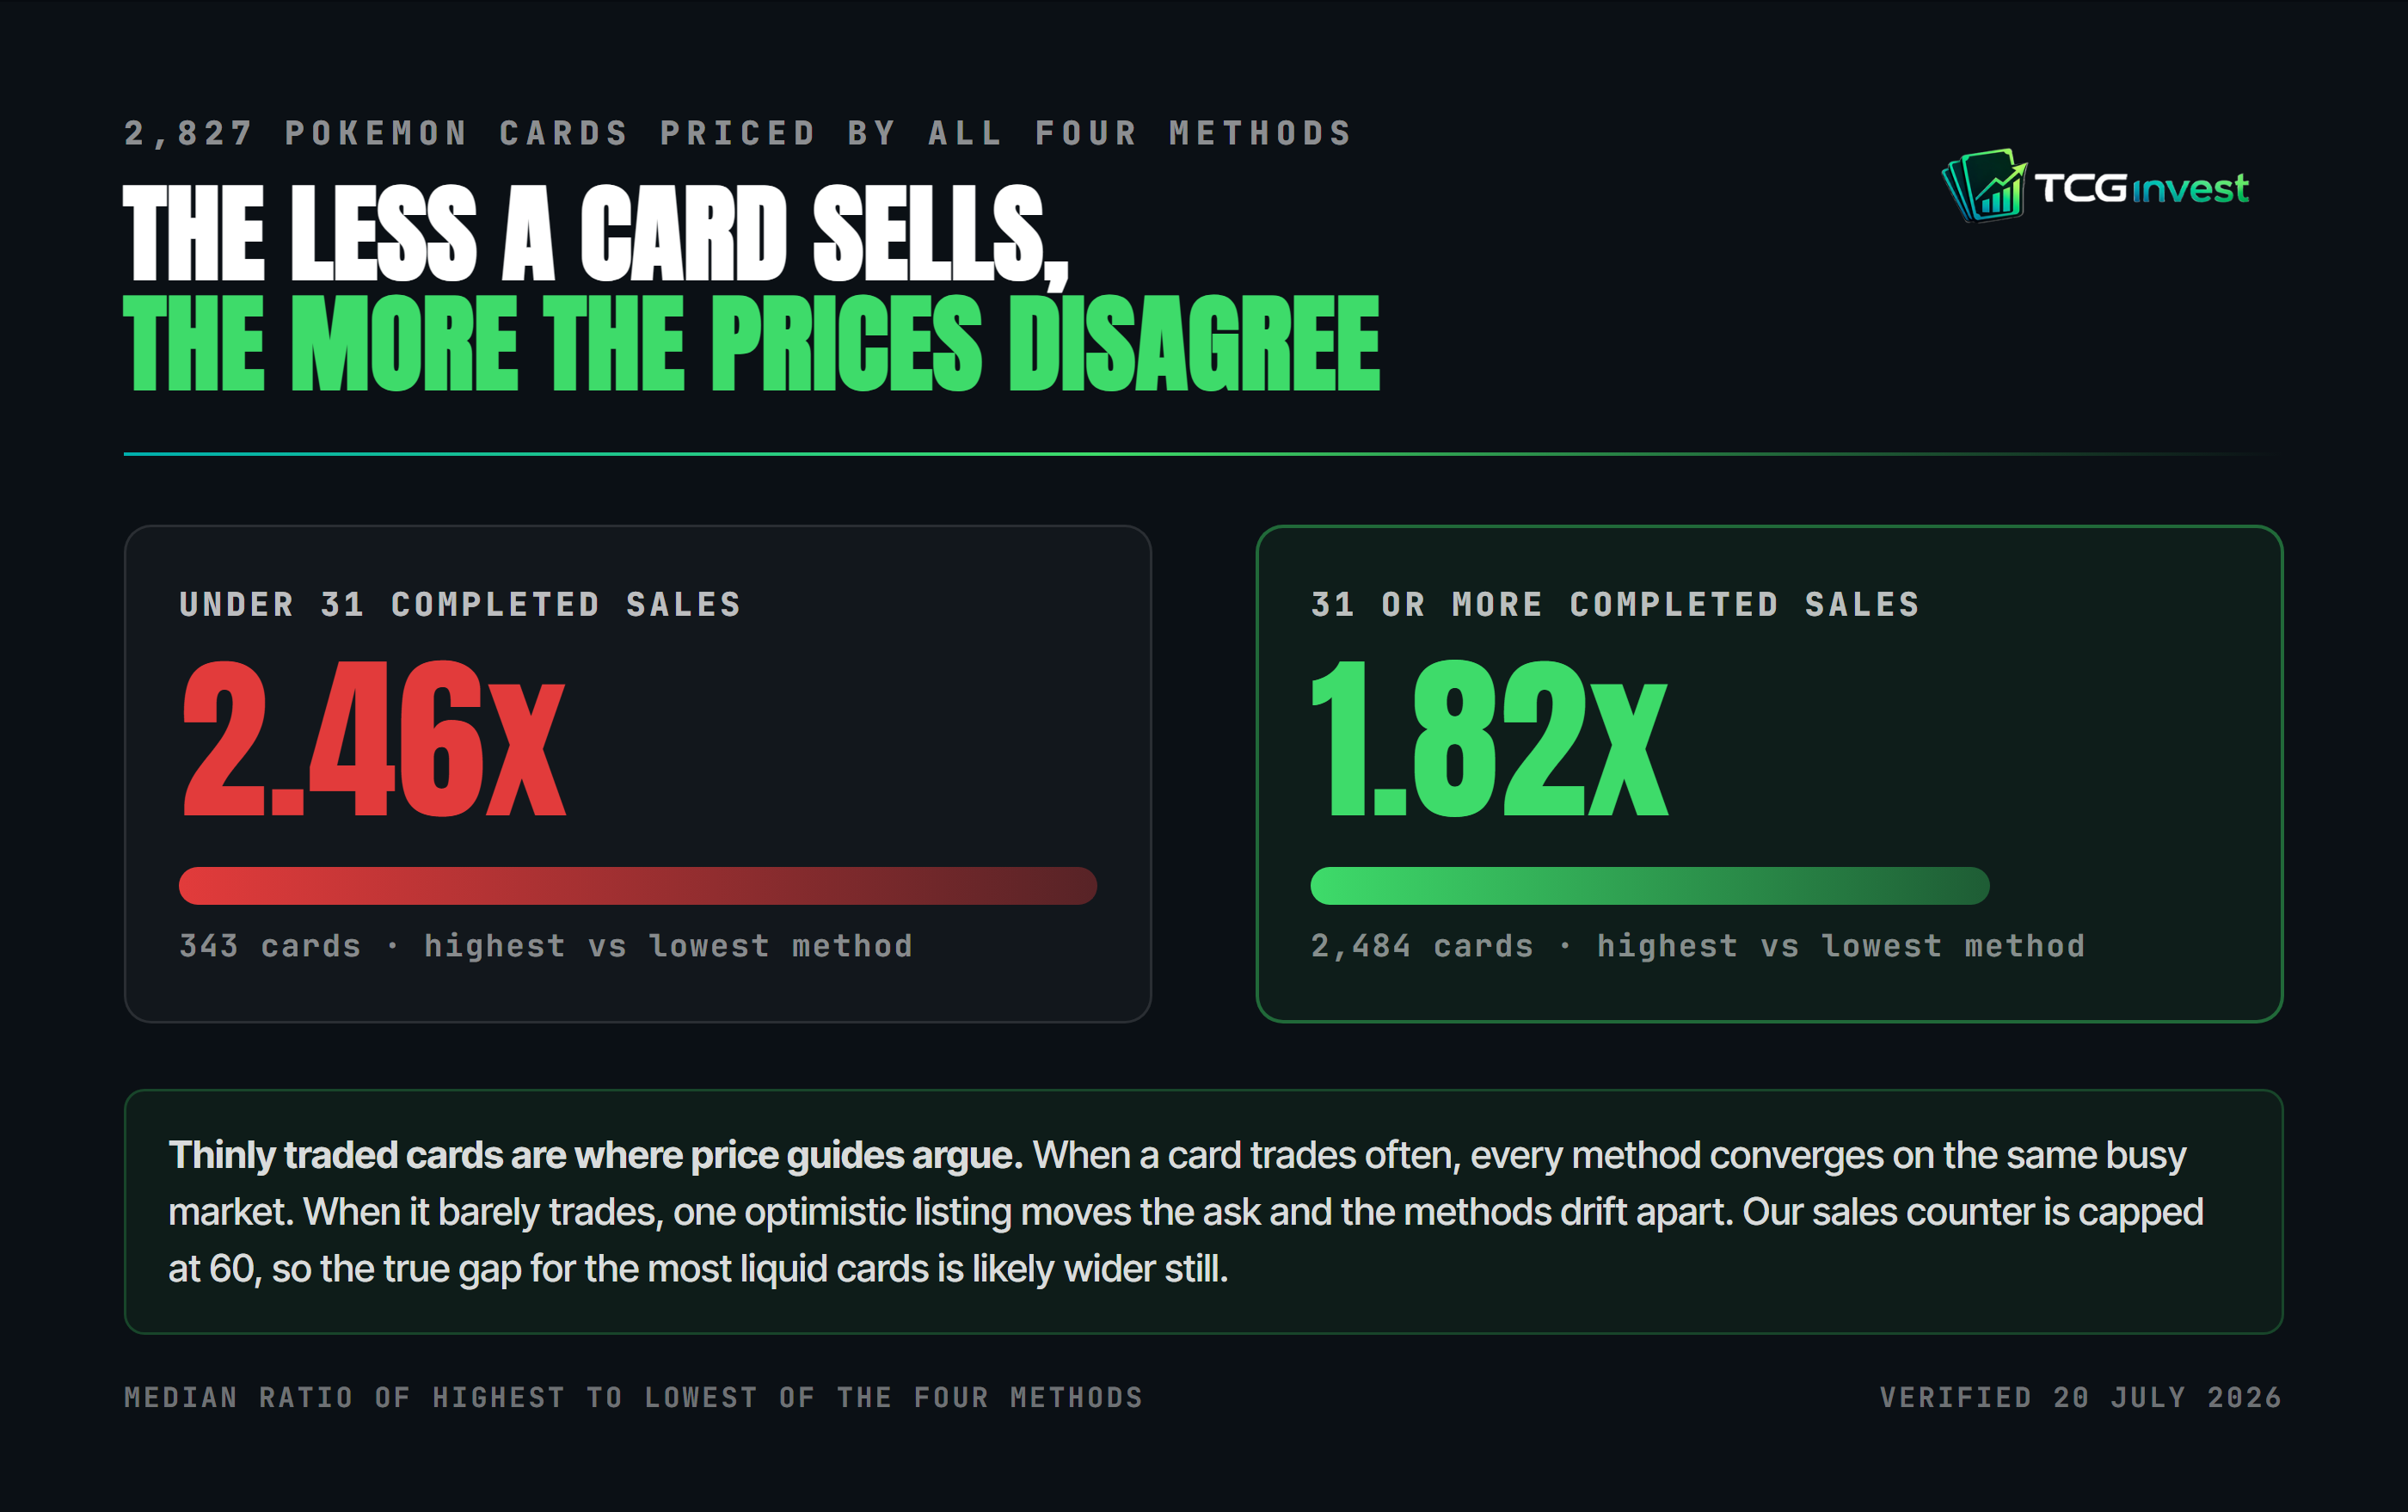
This is not just these two examples. Across 2,827 Pokémon cards priced by all four methods, cards with fewer than 31 completed sales disagree by 2.46x between the highest and lowest method. Cards with 31 or more disagree by 1.82x. Our sales counter is capped at 60, so the gap for the most liquid cards is likely wider still.
The more often a card sells, the more closely different pricing methods agree. Cards that rarely sell naturally produce a wider range of prices.
The second reason: two continents
Three of the numbers above are in euros and one is in dollars, and converting between them does not make them comparable, because Europe and the US are genuinely different markets.
Across the 3,370 Pokémon cards we can price in both markets, the median card sells for 31% less in Europe than in the United States, measured on 20 July 2026. We measured that gap card by card in the same Pokémon card costs less in Europe. That is not a data artifact. American volume runs through eBay and TCGplayer, and across the cards we track, realised US prices are higher on average than European ones.
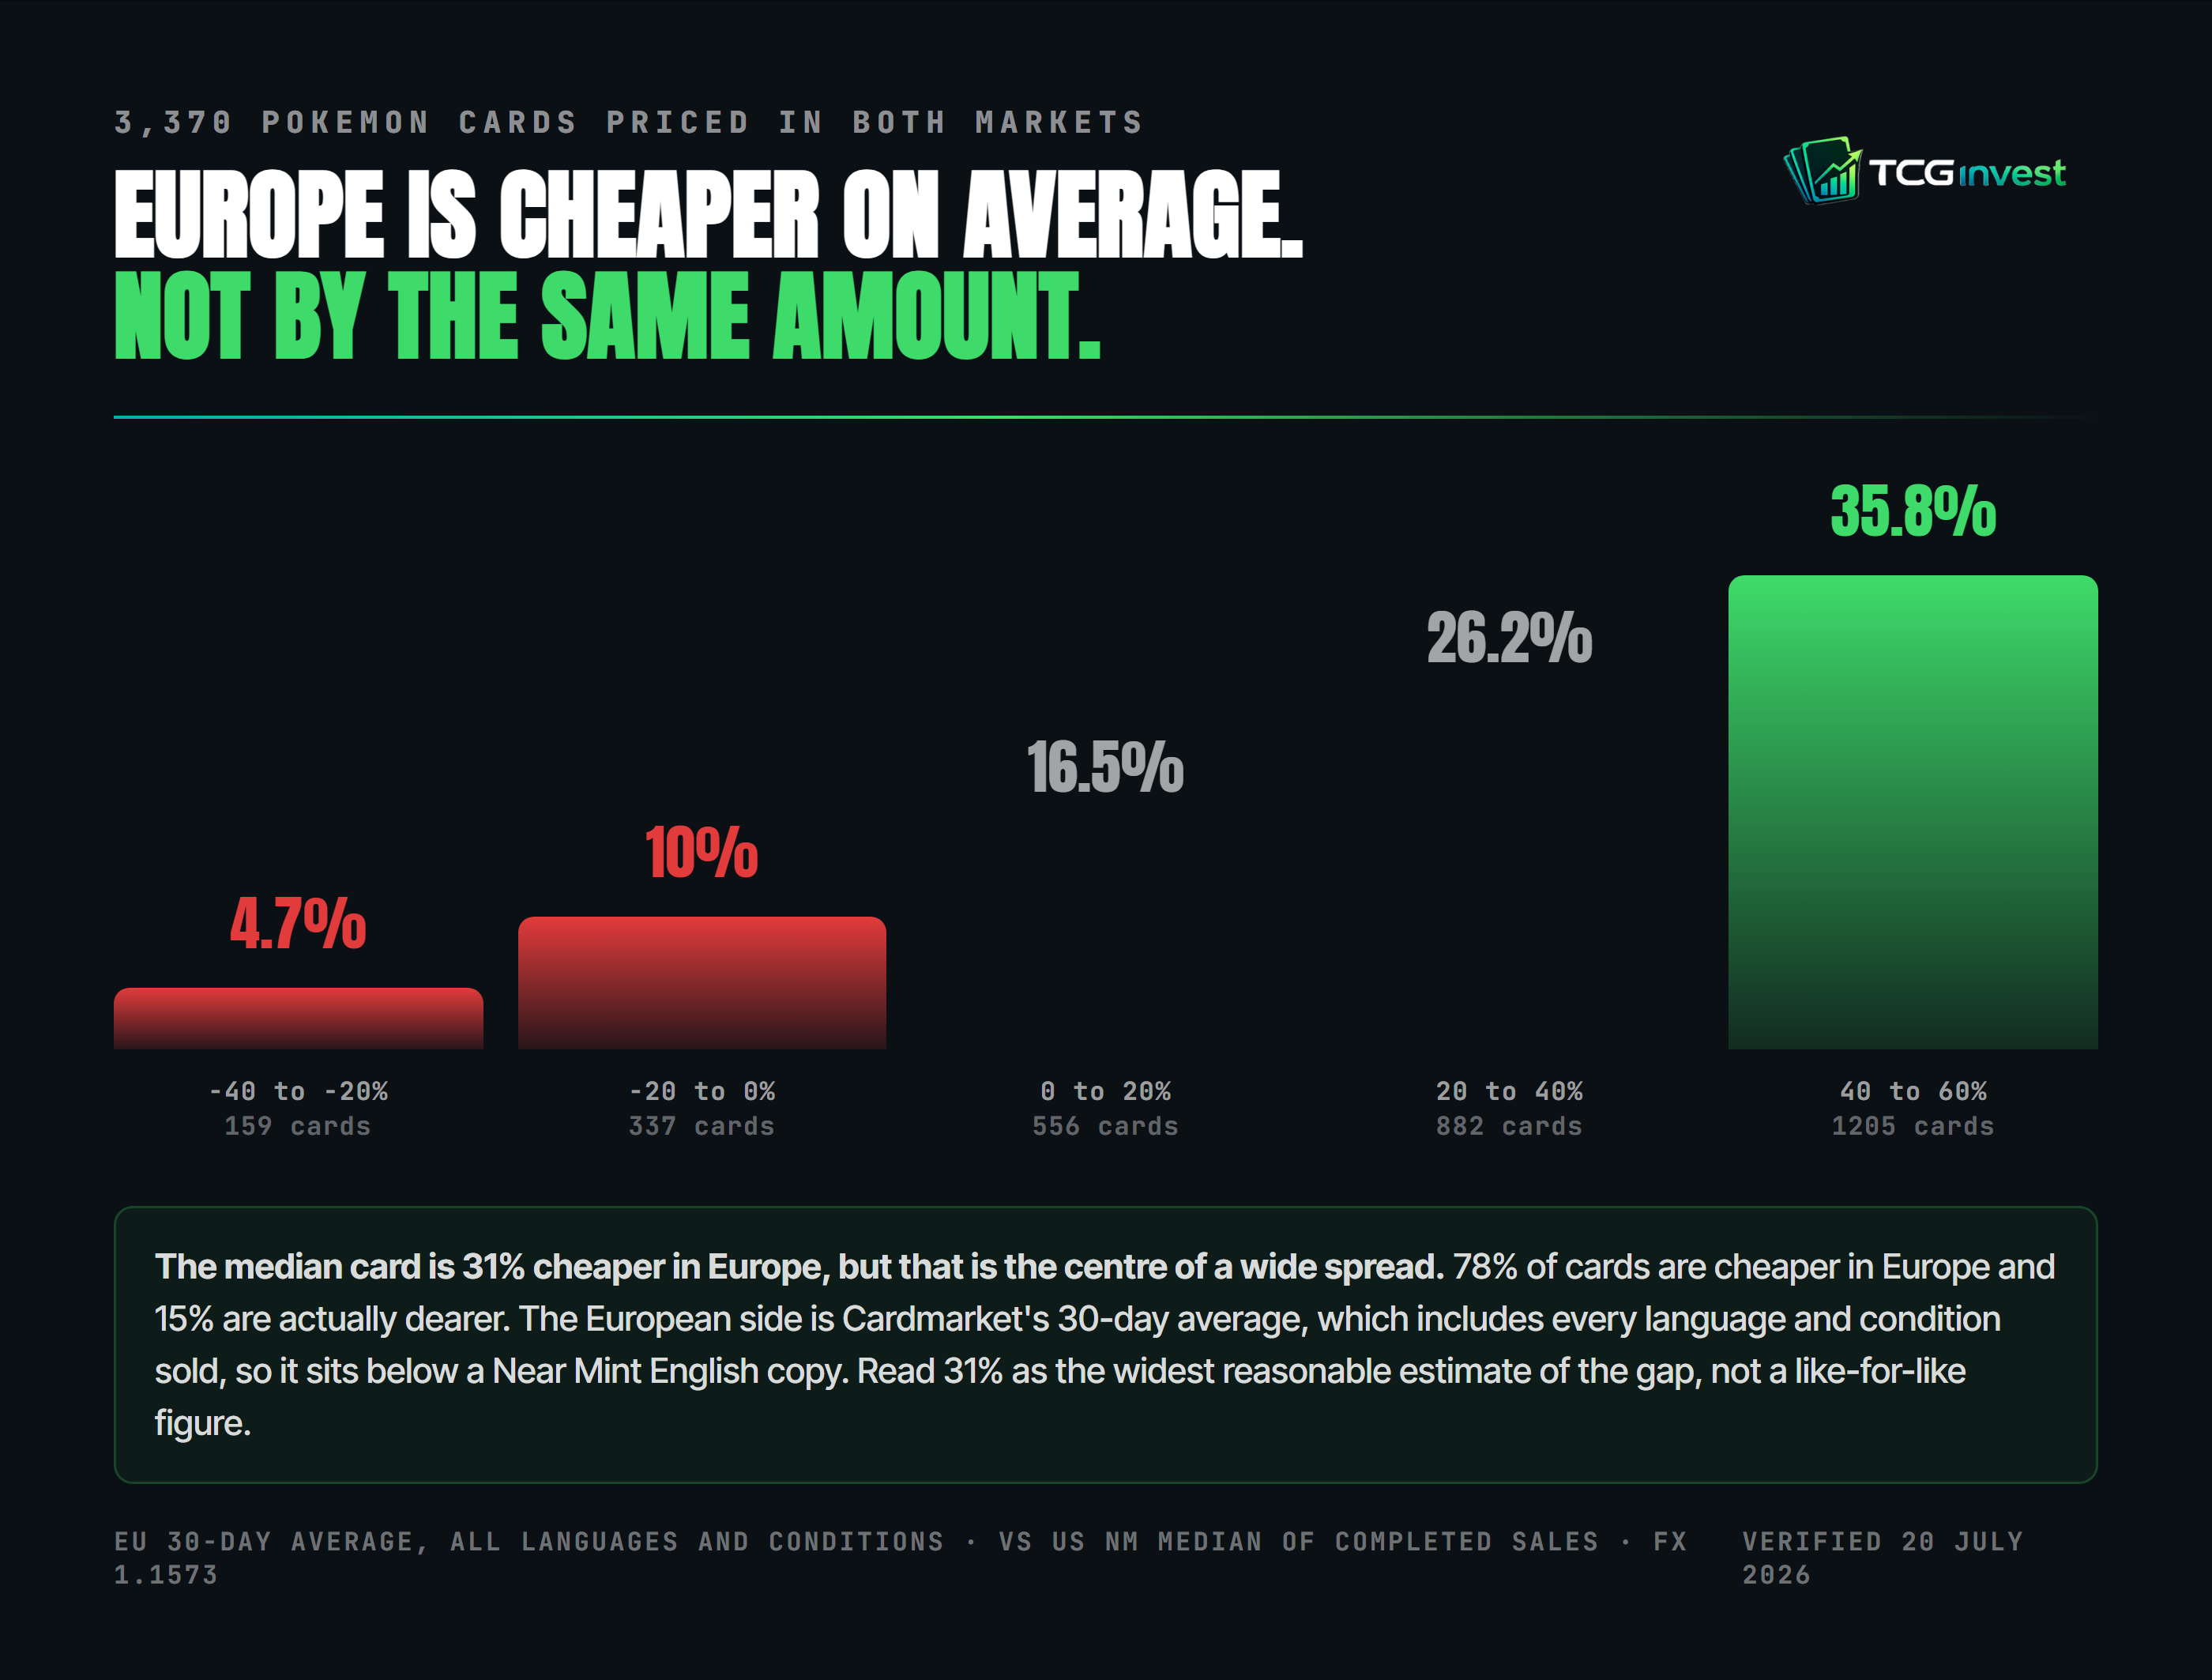
That 31% is the centre of a wide distribution, not a flat discount applied to every card. 78% of cards are cheaper in Europe, and 15% are actually dearer there.
So a site quoting you a US number and a site quoting you a European number will disagree by roughly a quarter before any methodology difference even enters.
How to read a Pokémon card price, whoever is showing it
- Ask or completed sale
- Europe or US
- Sample size
A median from 60 sales is a fact. A median from 3 sales is an anecdote wearing a fact's clothing.
What we do about it
We show Cardmarket data for Europe alongside PriceCharting's US data, with each figure labelled by source and method. If you want to see how the other tools handle this, we compared them in the best Pokemon card investment tools. Collapsing them into one number would throw away the most useful thing about having both. Where a card's data is too thin to trust, we show a dash rather than invent a number.
That is the only real defence against this problem: say which question you are answering, and show your sample size.
Related reading
- The same Pokémon card costs less in Europe: the 28% gap measured card by card
- The best Pokémon card investment tools: what each tool actually shows you
- How we calculate every price: sources, windows and sample sizes
Prices measured daily from Cardmarket (EU) and PriceCharting/TCGplayer (US). Sales counts are completed sales over a 180-day window. Nothing here is financial advice, and every number moves.