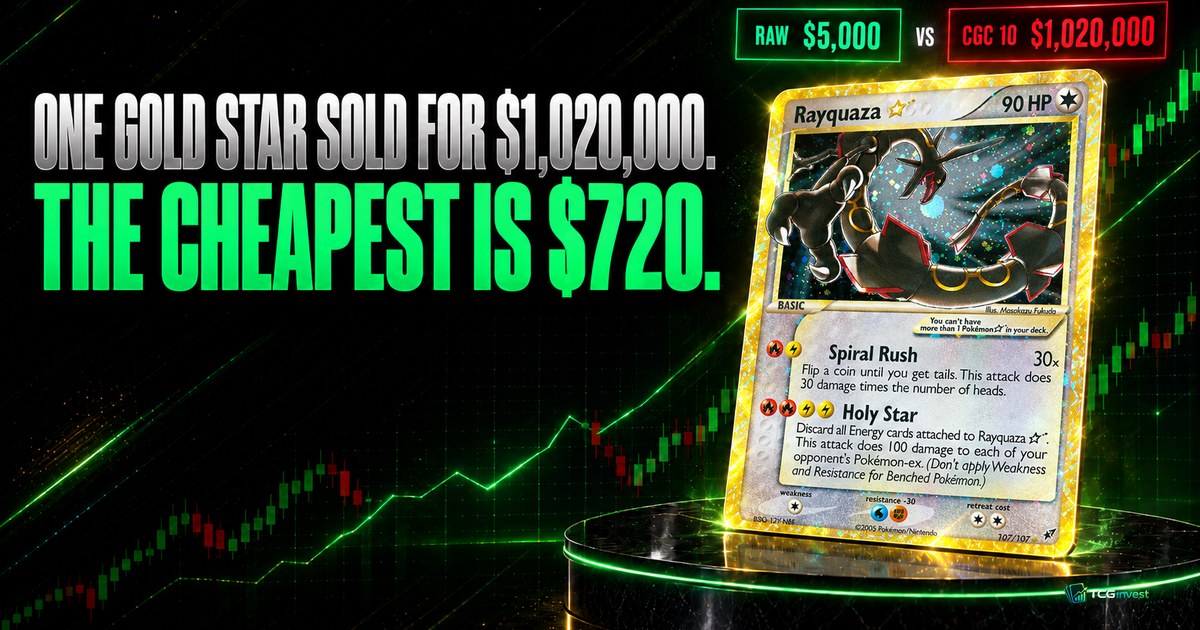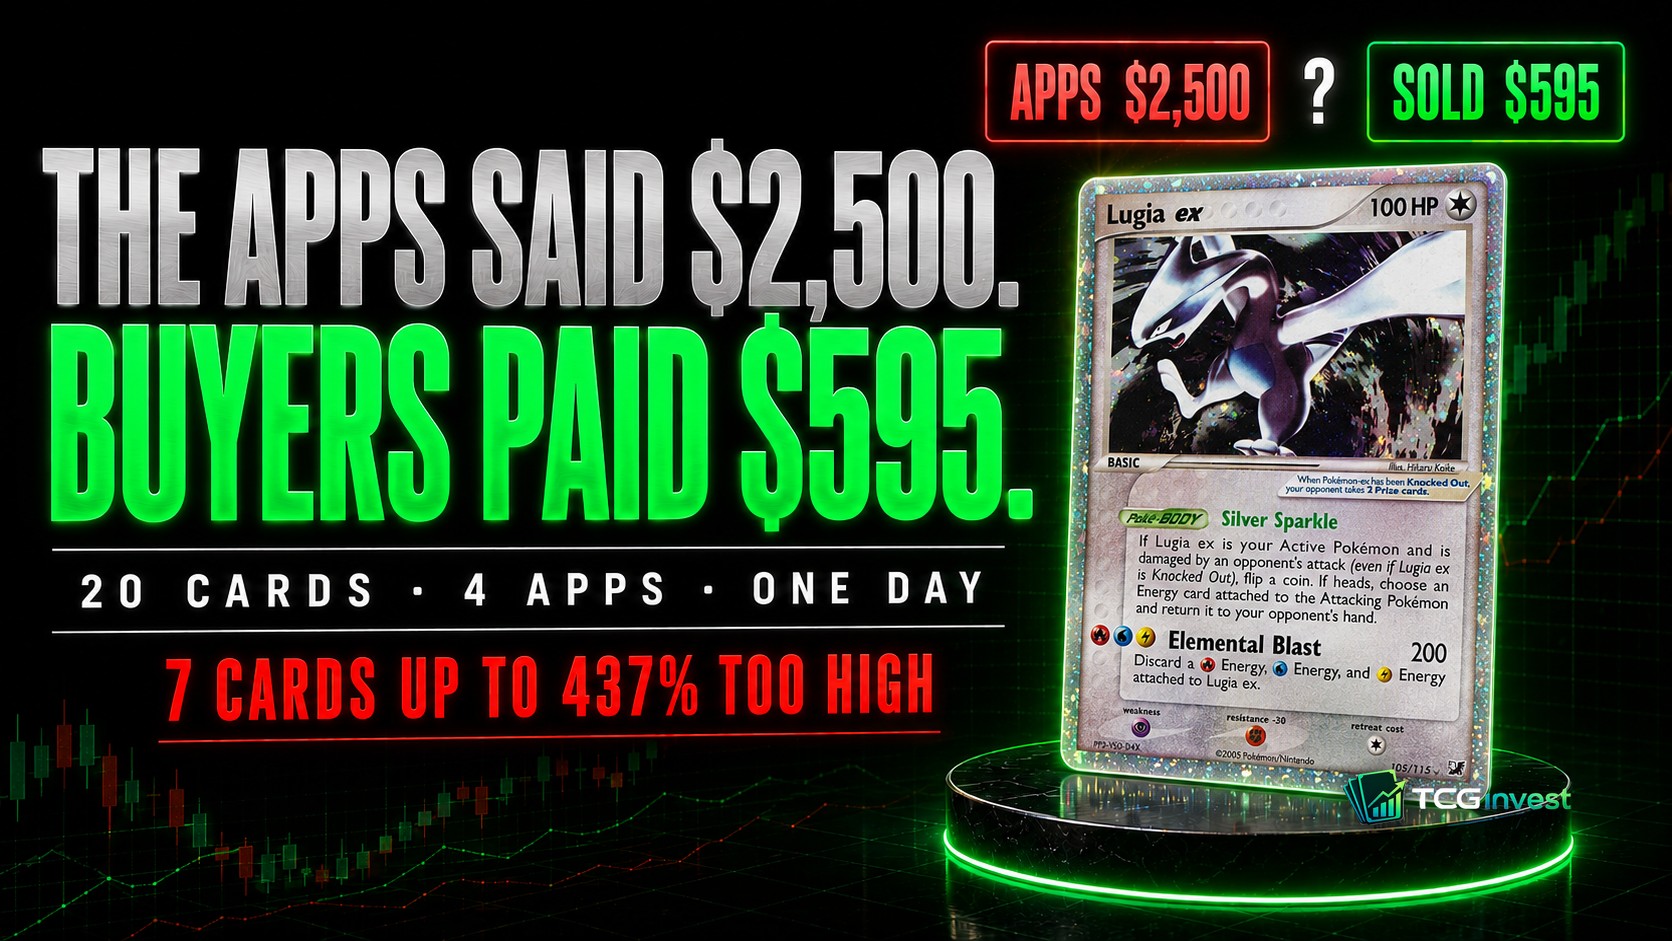

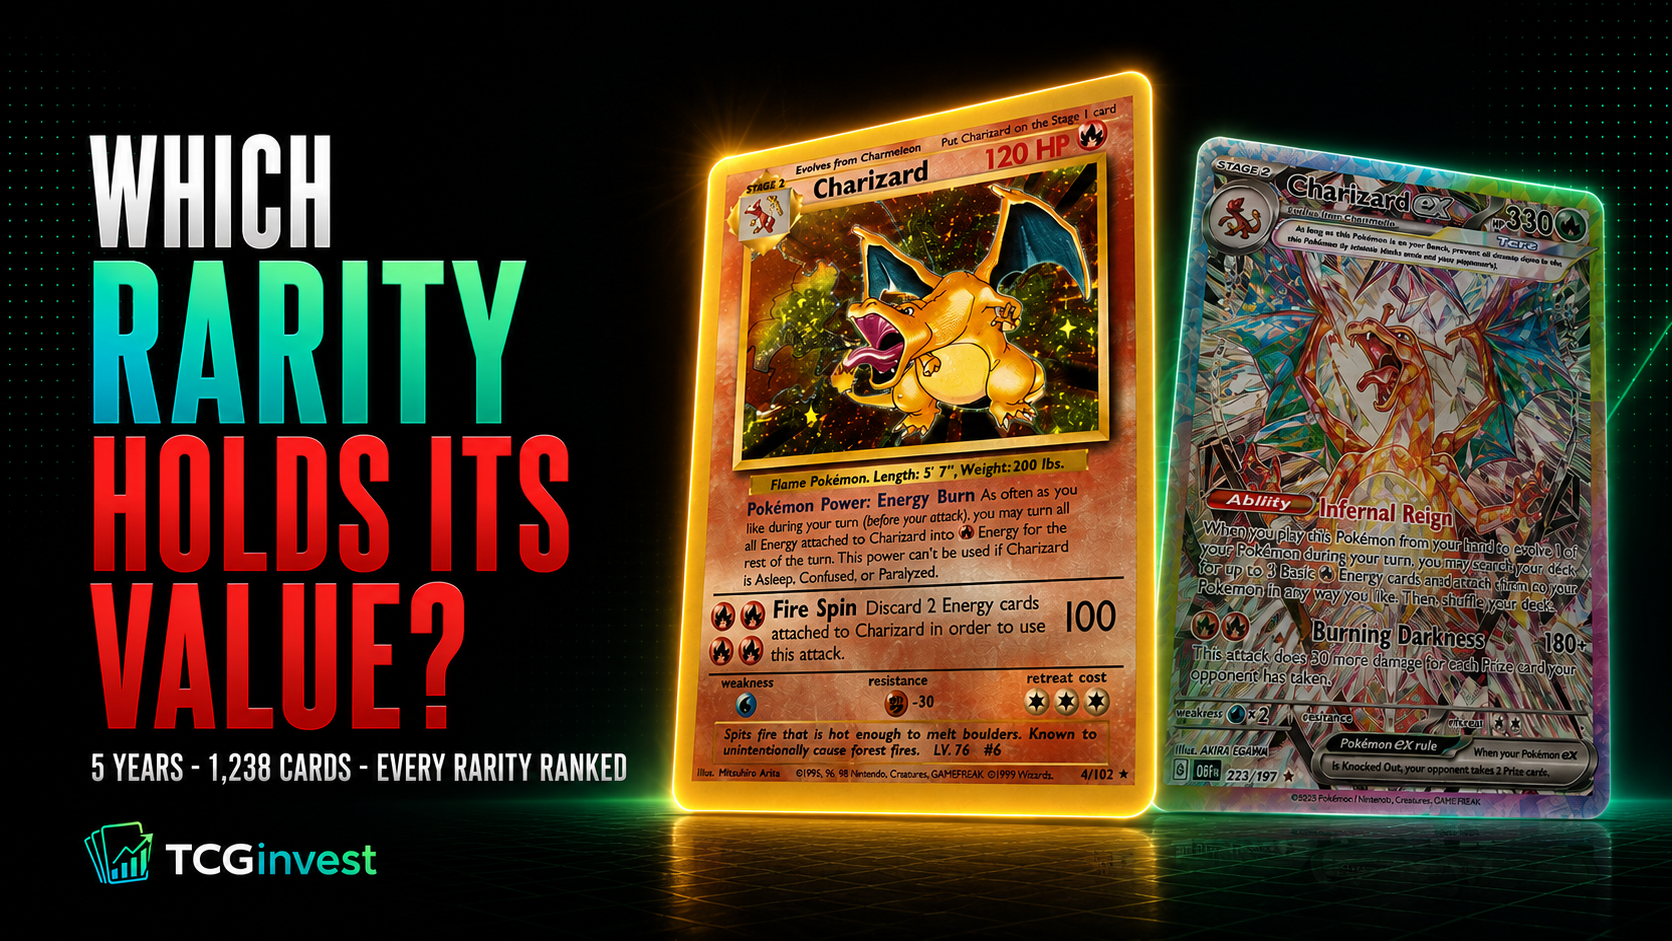
Our raw-vs-graded-vs-sealed study found something we did not expect: scarcity was not linked to protection, and the rarest cards fell hardest. This study asks the sharper version of that question. Sort every card by the one thing collectors actually pay a premium for - its printed rarity - and measure how each rarity type held value across the same five years. Does the label predict the return?
One thing to fix in place before the numbers: you do not buy a rarity, you buy a card. This is not a basket you can hold. It is a test of whether the rarity stamp predicts return. It mostly does not, and that is the useful part: the label on the card will not tell you which card to buy.
This is a TCGinvest analysis of 1,238 English raw singles, grouped by their printed rarity and measured monthly from January 2021 to June 2026. Same universe as our earlier work, same rules, and the same metric that ties return and risk together: return earned for every unit of pain, annual return divided by the worst fall along the way, which finance calls the Calmar ratio.
Key findings, up front:
- The printed rarity label was a weak predictor of return. What ordering did appear tracks the year a card was printed far more than how rare it looks - the two are braided together in this data and cannot be fully pulled apart.
- The strongest buckets are old: Gold Star (+30.7% per year, but only 13 cards), full-art Ultra rares (+25.2%), and the plain holo-EX (+22.8%). Every one of them is a pre-2016 print. What survives the small buckets is that era gradient, not any single rarity's crown.
- The Rainbow rare, the flashiest modern chase pull, posted the lowest annual return of any rarity we could measure: +9.7% per year. Notably its -57% fall was milder than the commons it underperformed (-69%) - low return, not the deepest crash.
- As raw singles, the modern chase mechanics (V, VMAX, VSTAR, the Scarlet-Violet "ex") rarely even clear a $20 liquid floor, so they were filtered out, not measured and beaten. We make no return claim about a rarity we could not score.
- No label was spared the drawdown. Even the best-holding tier gave back 47% peak-to-trough; the median tier fell about 60%.
Collectors treat rarity as a proxy for value: the harder a card is to pull, the safer it is assumed to hold. The modern set structure runs on that belief, stacking Rainbow rares, secret rares and alternate arts above the base pull precisely because buyers pay more for the scarcer tier. This study measures whether that premium was earned. We took every raw single that already passed our public gates, grouped it by the rarity printed on the card, and let the five years of prices decide.
Two scope notes before the results. First, the gate is a liquidity and price floor, not a chase-card screen: at least 15 tracked sales in 180 days and at least $20 raw, from a catalogue of roughly 24,000 cards. It is deliberately broad because we are testing a signal, not recommending a basket. Second, this is a raw-singles study. Graded modern - the PSA 10 alternate arts where a lot of the contemporary money actually sits - is a different instrument with a different return profile, and we treat it separately. Every conclusion below lives inside "as a raw single." The universe was fixed before the results existed, nothing was hand-picked, and "peak" always means each card's own 2021-era high. The full rules sit in the methodology box near the end.
The scoreboard
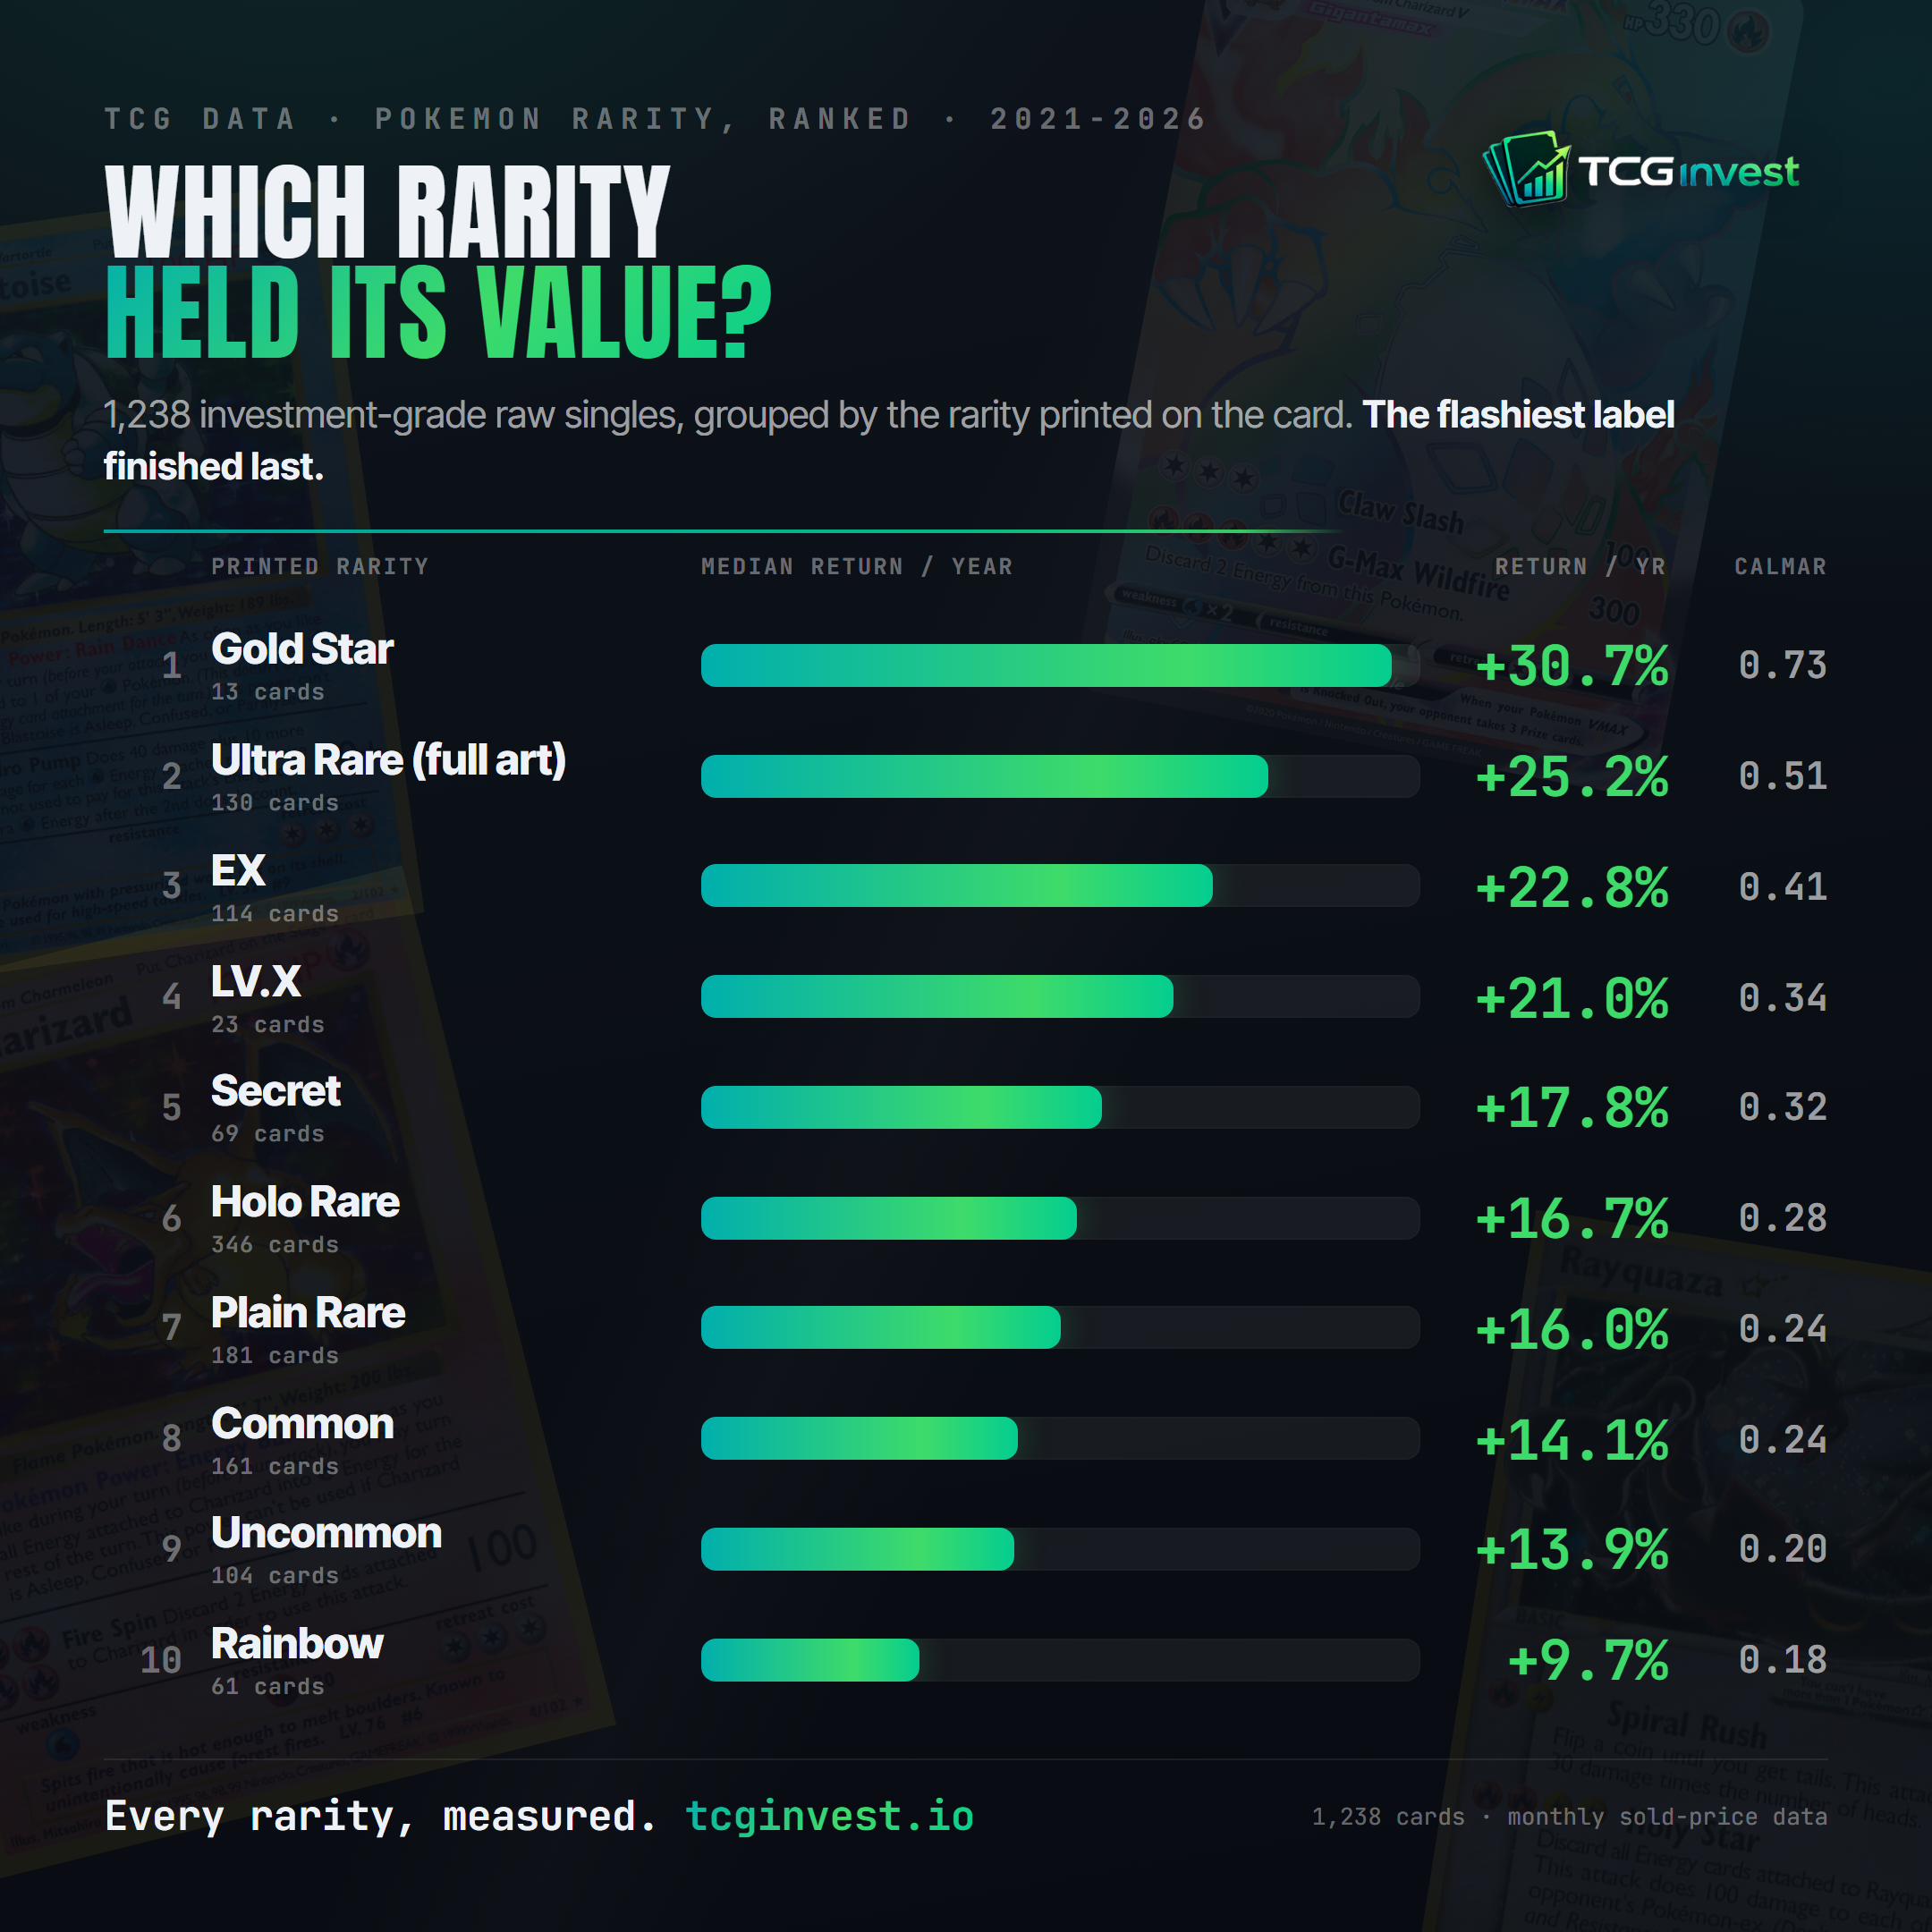
| Median per card | n | Return / yr | Max drawdown | Calmar | Median print year |
|---|---|---|---|---|---|
| Gold Star | 13 | +30.7% | -47% | 0.73 | 2006 |
| Ultra Rare (full art) | 130 | +25.2% | -49% | 0.51 | 2015 |
| EX (2003-07 & 2014-16) | 114 | +22.8% | -55% | 0.41 | 2006 |
| LV.X | 23 | +21.0% | -68% | 0.34 | 2009 |
| Secret | 69 | +17.8% | -55% | 0.32 | 2012 |
| Holo Rare | 346 | +16.7% | -60% | 0.28 | 2003 |
| Plain Rare | 181 | +16.0% | -65% | 0.24 | 2003 |
| Common | 161 | +14.1% | -69% | 0.24 | 2005 |
| Uncommon | 104 | +13.9% | -69% | 0.20 | 2005 |
| Rainbow | 61 | +9.7% | -57% | 0.18 | 2018 |
Read the last column and the order stops being a rarity story. The buckets on top are the old ones. The Gold Star tops the table on 13 cards, so we read it as one more point consistent with the pattern rather than a standalone verdict; the finding that survives the thin buckets is the gradient itself, measured across the well-populated tiers - Holo Rare (346 cards), Plain Rare (181), Common (161), Uncommon (104). Even inside a single rarity the era shows through: the Holo Rare bucket spans 1999 to 2019, and it lands mid-pack, exactly where an era-mixed group should.
Every metric, in one place
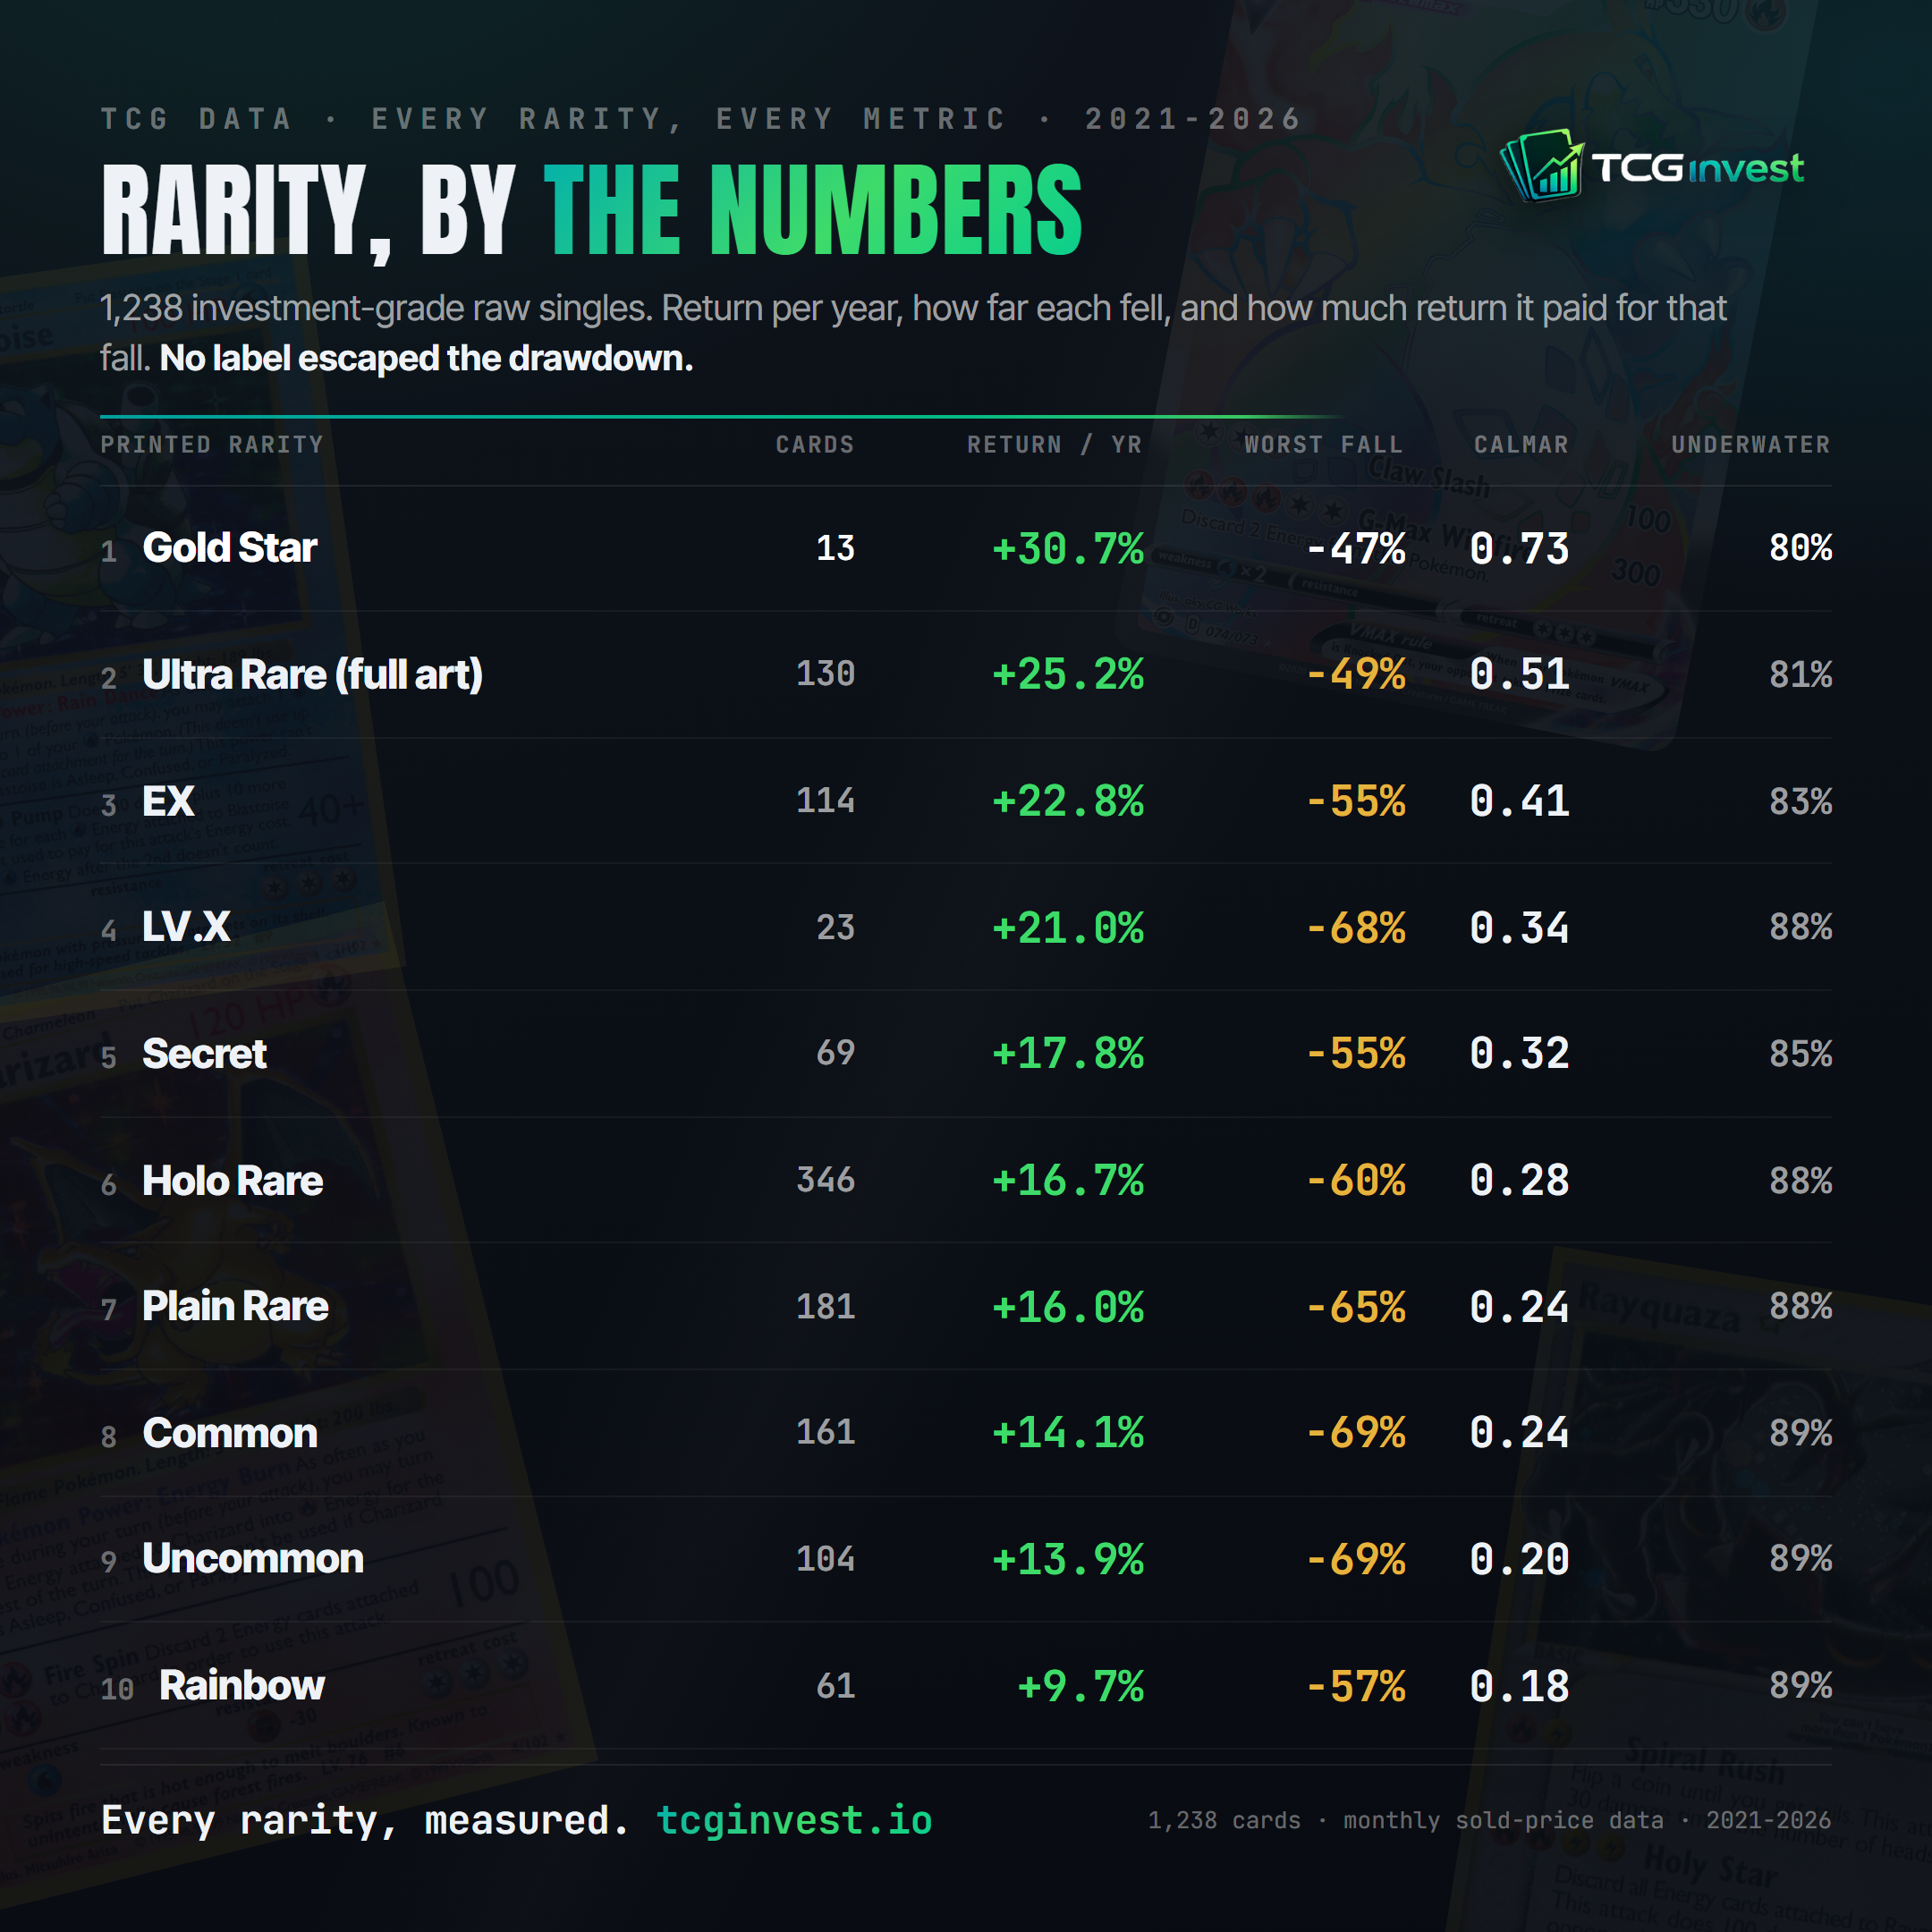
For readers who want the whole board at once: return, the worst fall each tier took, the return it paid for that fall, and how much of the five years it spent below an earlier high. Two things stand out. The Calmar column - return per unit of pain - falls almost monotonically down the table, from 0.73 to 0.18. And the "underwater" share never drops below 80%: whatever the rarity, a holder spent most of the window looking at a lower price than they had already seen.
No rarity bought protection
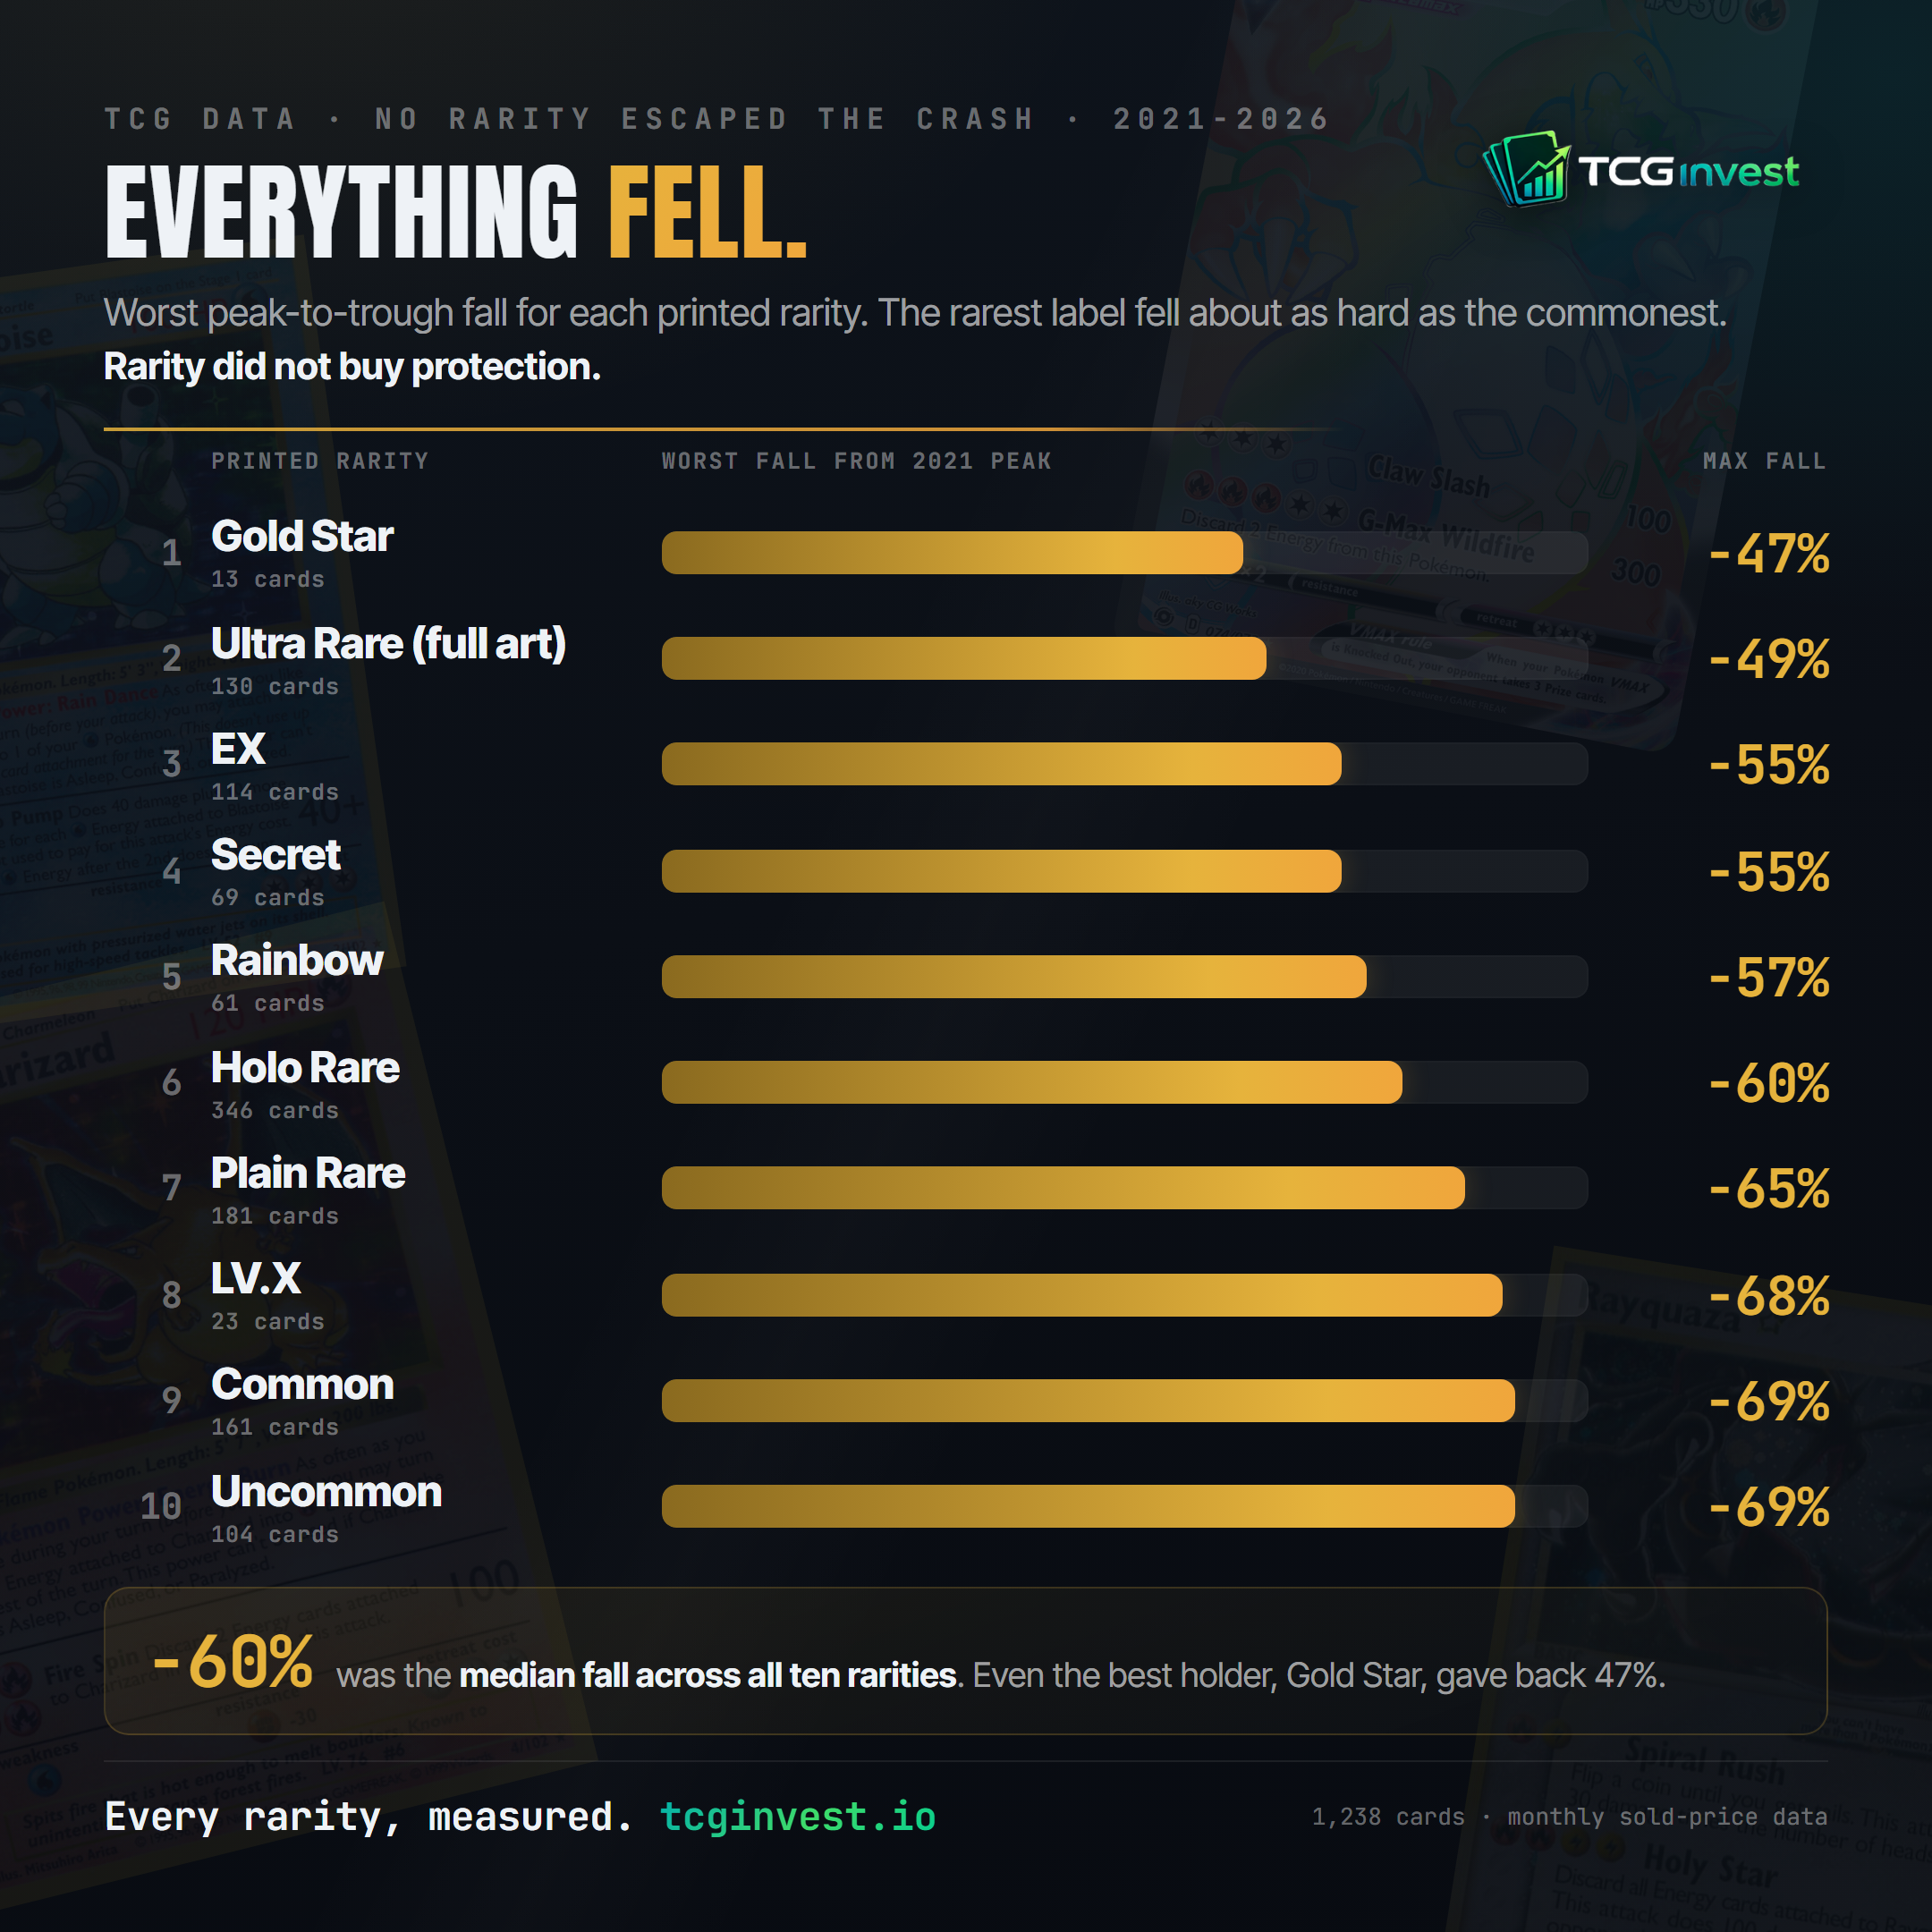
Here is the part the pull-rate instinct gets most wrong. Rarity did not buy a softer fall. The best-holding tier still gave back 47% from its peak; the median tier fell about 60%; the commons fell 69%. The differences between rarities are in how much return they paid for that fall, not in whether they fell. This echoes our raw-vs-graded finding directly: scarcity, on its own, was not linked to protection.
The flashiest label had the lowest return
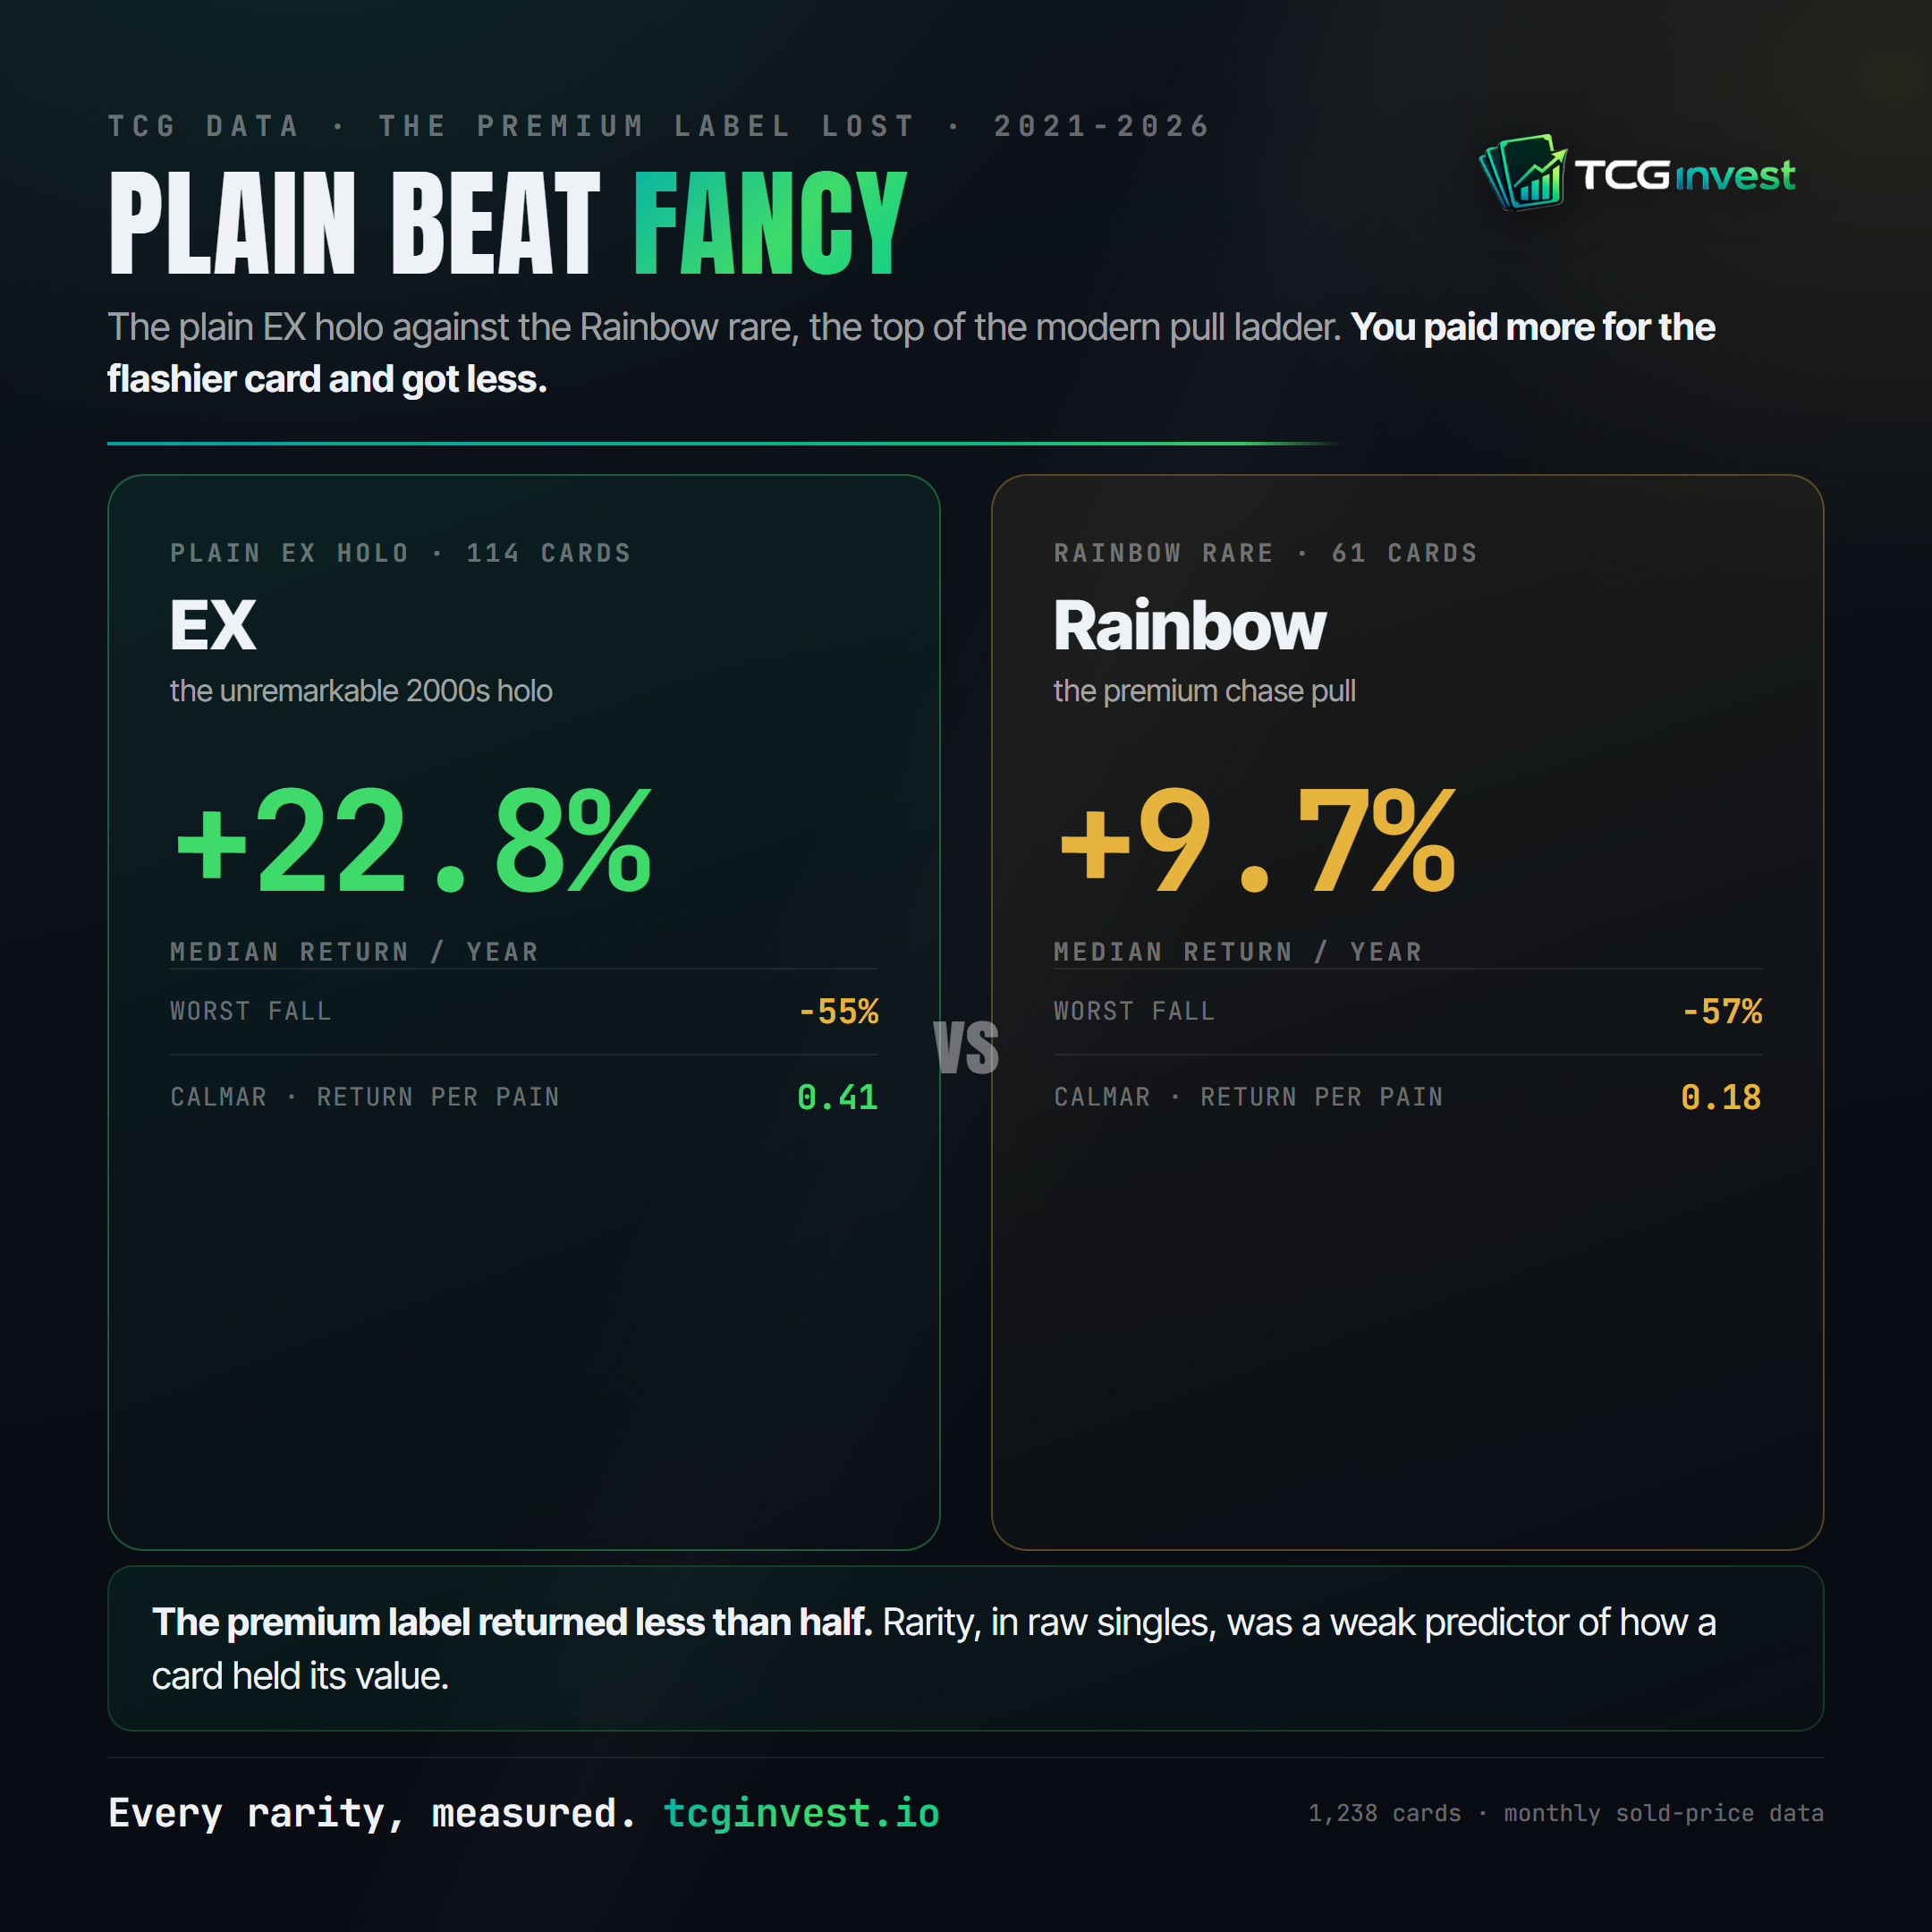
The Rainbow rare is the premium chase pull of the modern era, the full-color secret slot that sits at the top of a set's rarity ladder and commands the biggest single-card premium at the counter. Across this window it returned +9.7% per year, the lowest of any rarity we could measure, at a Calmar of 0.18 - roughly a quarter of the risk-adjusted return the plain EX holo produced.
Be precise about what "lowest" means here, because it is a return statement, not a crash statement. Rainbow's -57% fall was actually shallower than the Holo Rare (-60%), the Plain Rare (-65%) and the commons (-69%) it trailed on return. It did not fall the hardest; it simply appreciated the least. In this dataset the premium tier of the modern rarity ladder did not reward the premium price - not because it was uniquely fragile, but because it barely grew.
It wasn't the rarity, it was the year
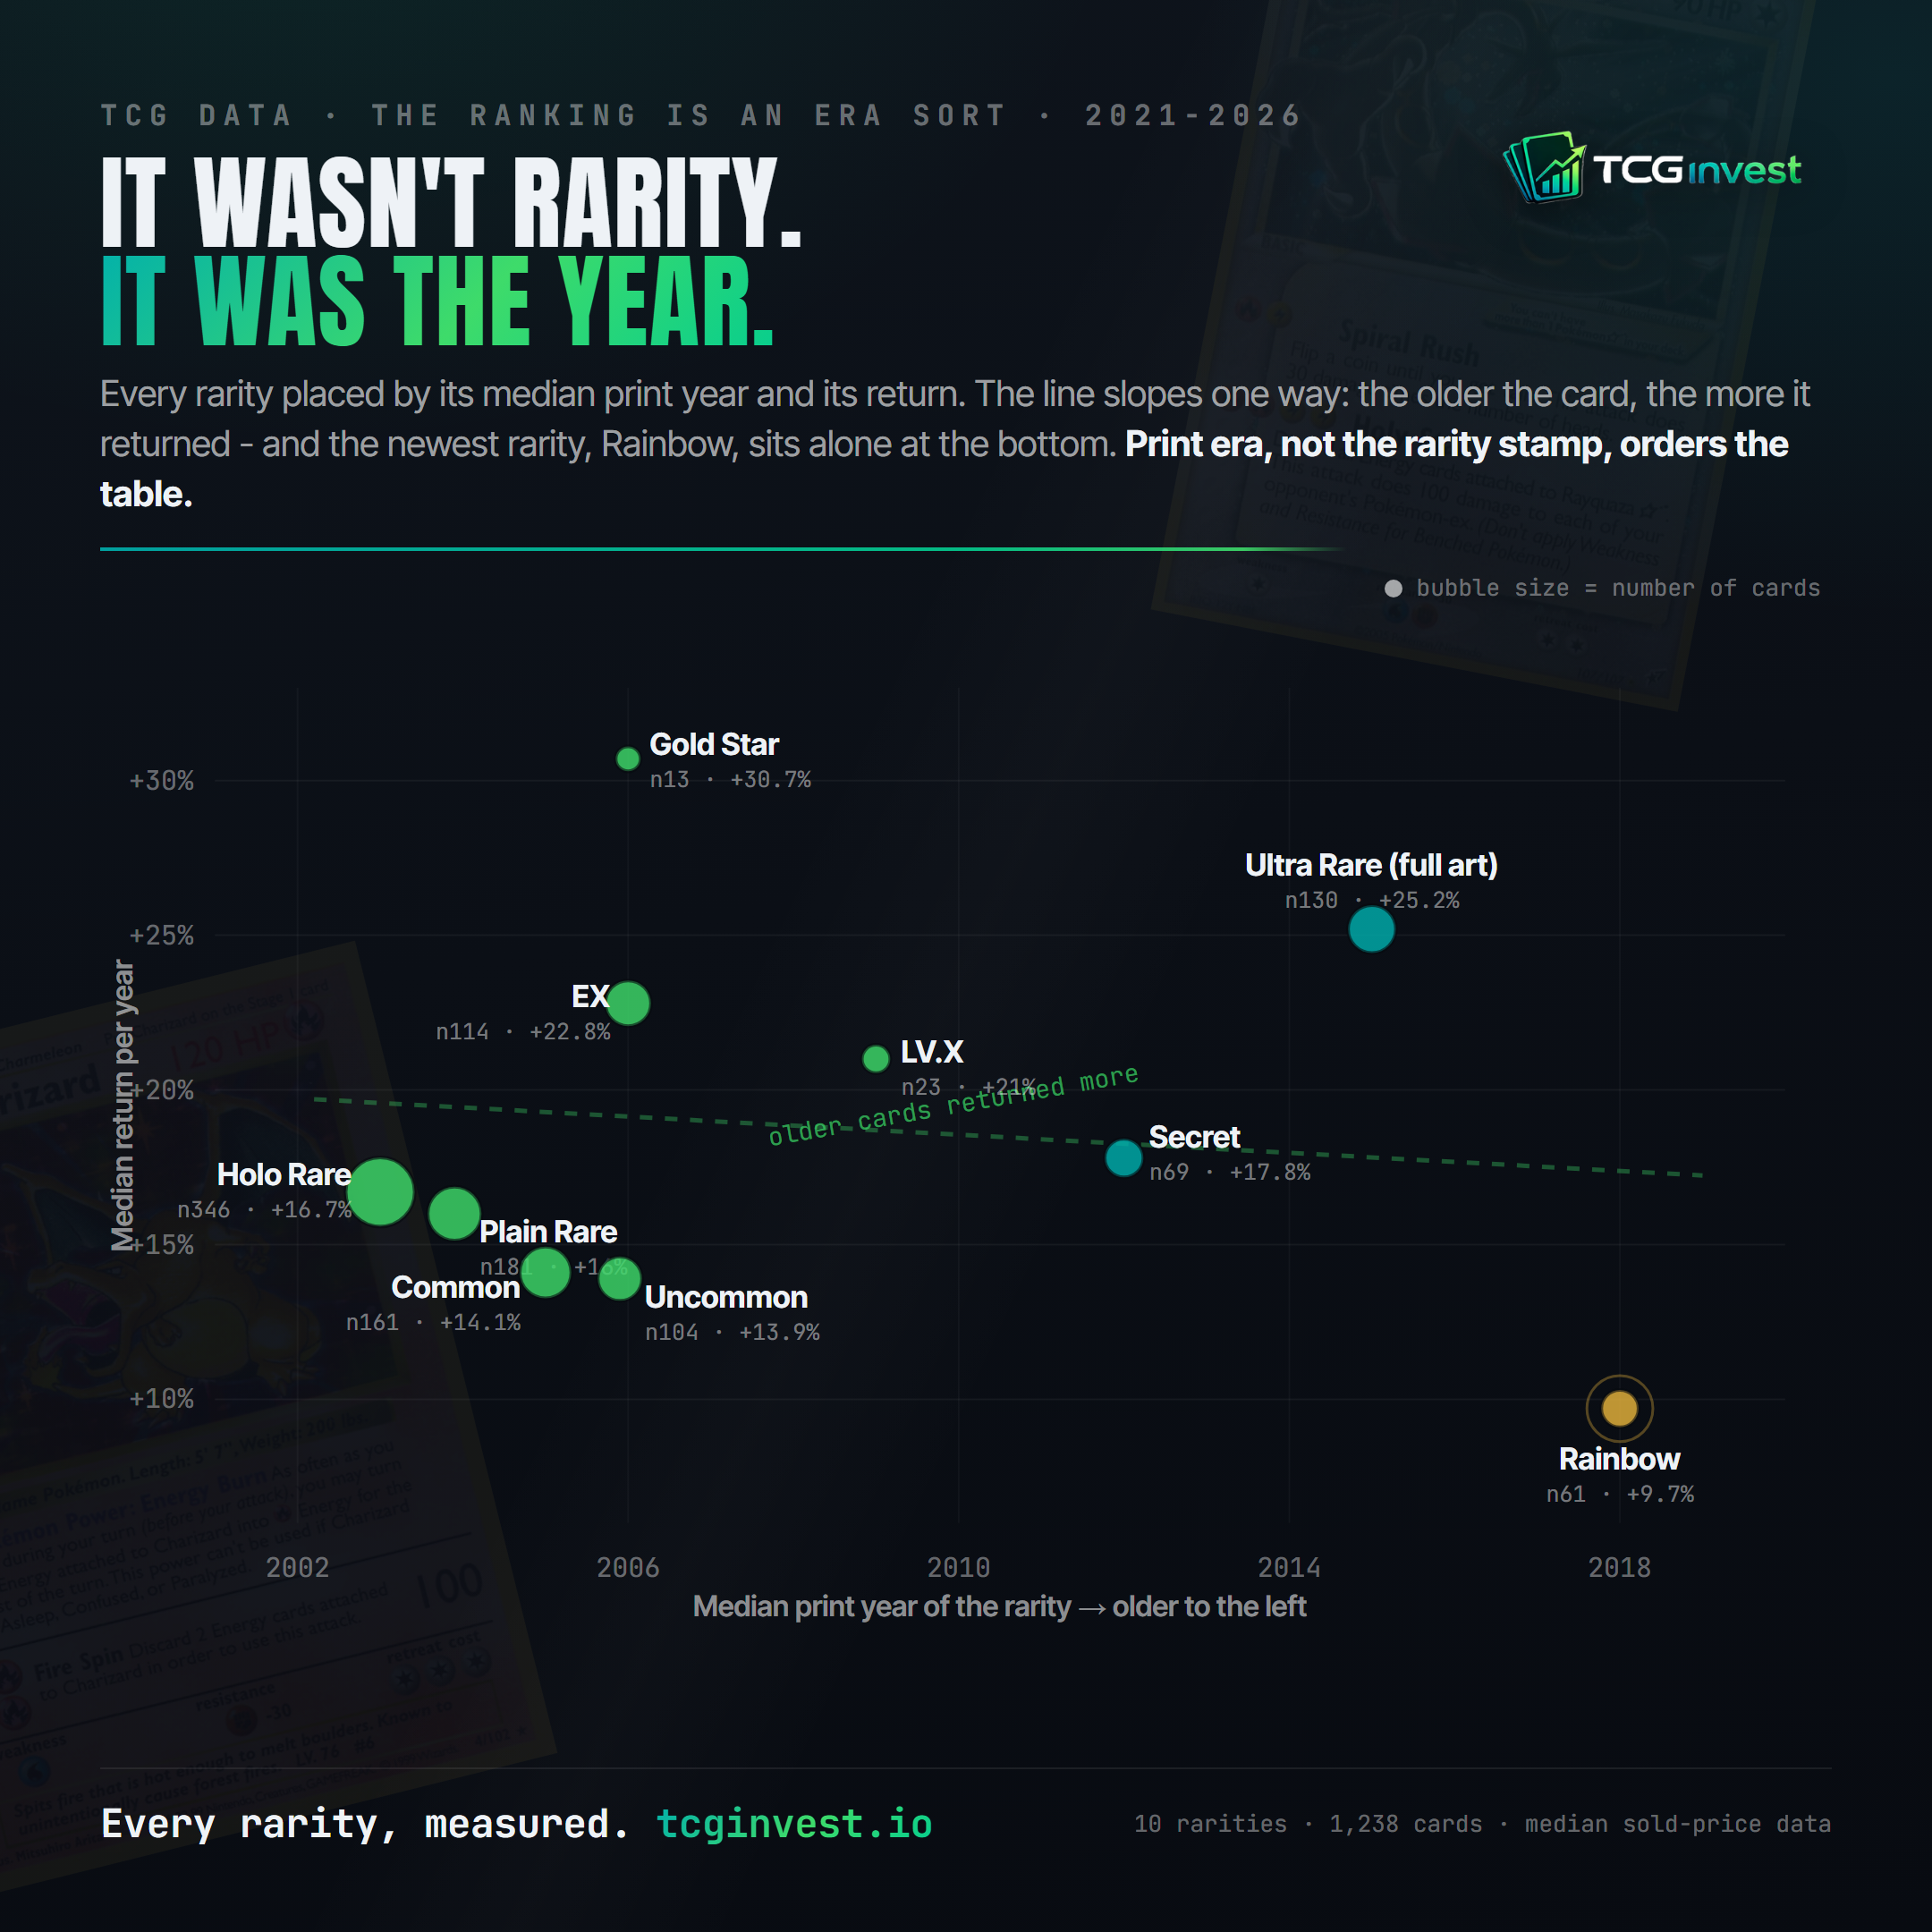
This is the limitation to read before quoting any single number, and it is really the whole finding. Rarity and print era are braided together, and this design cannot fully separate them. Plot each rarity by its median print year and the ranking mostly straightens into a line: the older the card, the more it returned. Gold Star existed only from 2004 to 2007. LV.X only from 2008 to 2009. Rainbow rares only from 2016 onward, and they sit alone at the bottom-right. So "Gold Star and EX beat Rainbow" is, in large part, "2006 cards beat 2018 cards" - the same vintage-and-survivors effect our earlier studies surfaced, wearing a rarity label.
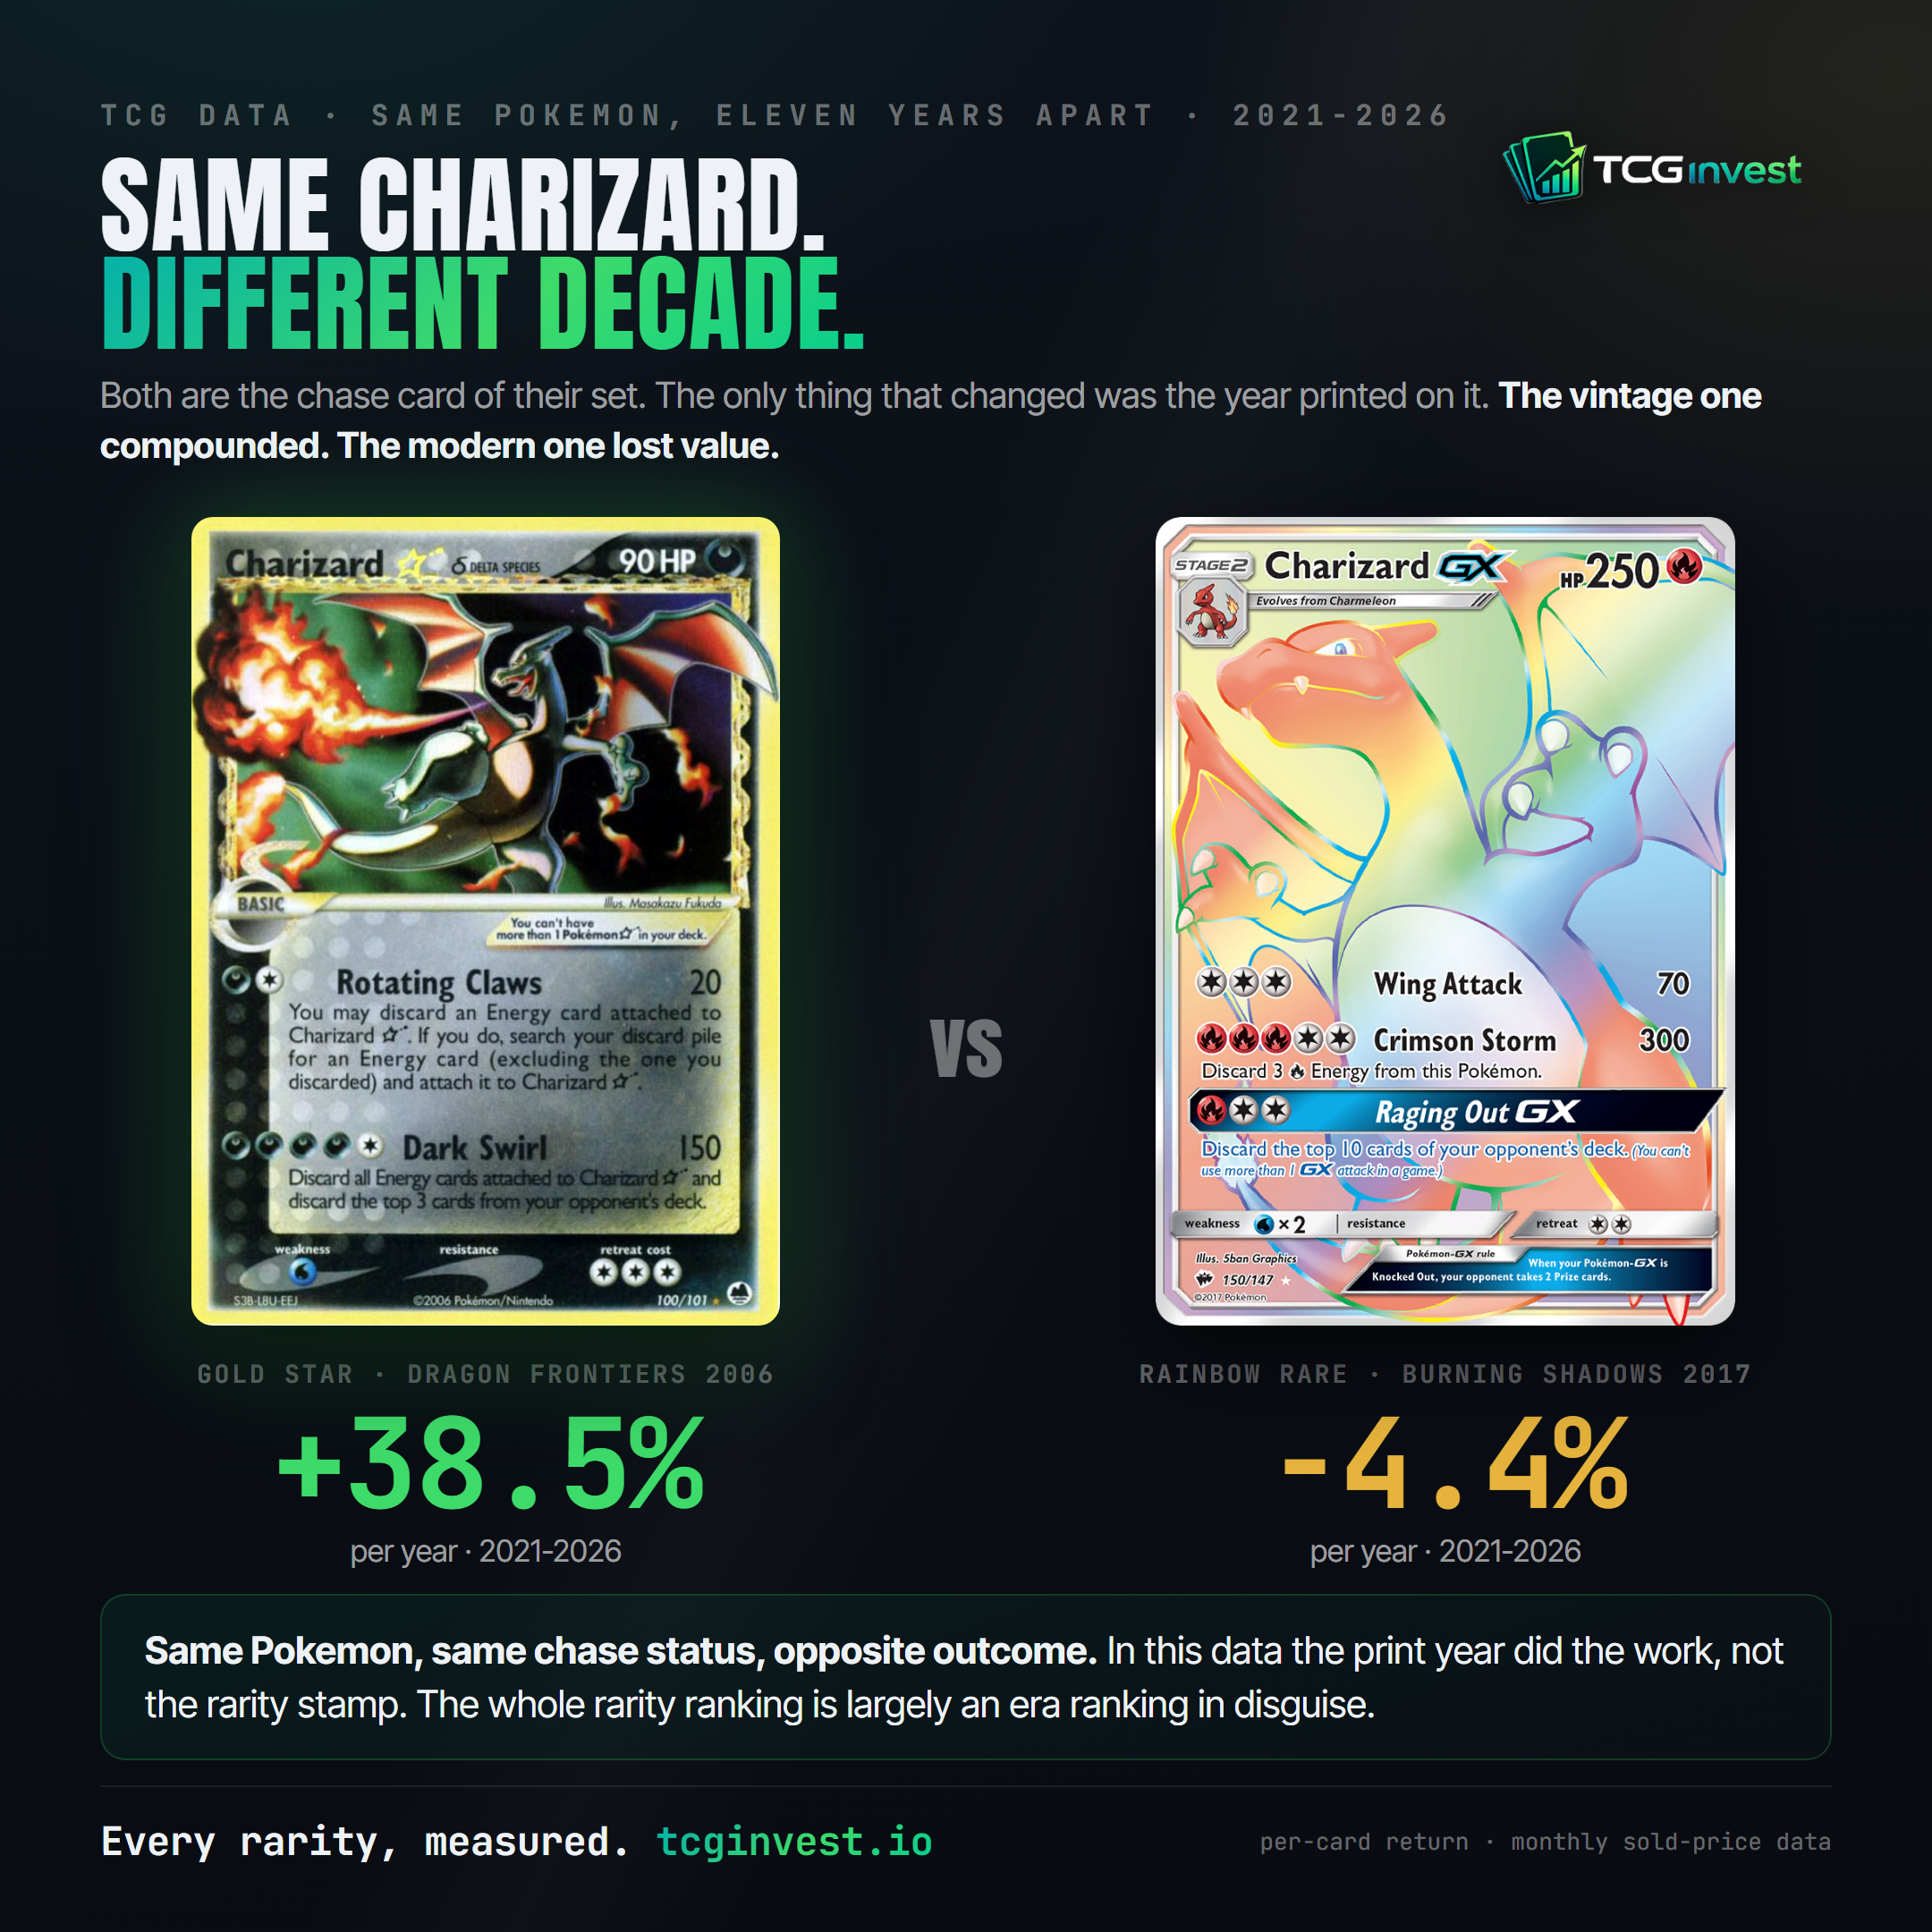
The single cleanest way to see it is to hold the Pokemon constant. The returned +38.5% per year across this window. The - same character, same "chase card of the set" status, the flashier print by any visual measure - returned -4.4% per year. The only variable that changed was the decade printed on the card. When the rarity is held to the same Pokemon, it is the year that moves the outcome.
The modern chase cards barely qualify at all
There is a rarity ladder we could not rank, and its absence is itself a result. The V, VMAX, VSTAR and Scarlet-Violet "ex" mechanics that dominate every pack opened since 2020 almost never cleared the study's liquid floor. Not because they are too young to have a price history, but because as raw singles, most of them trade under $20. The base mechanic card is cheap in hand; the money sits in the alternate-art and secret versions, which carry a different rarity tag entirely - the full-art Ultra rare tier, cards like the , that placed second above.
So we do not say the modern premium pulls "lost." They were filtered out by construction, and we make no return claim about a universe we did not measure. What we can say plainly is narrower and sturdier: the raw market does not treat a standard modern V or VMAX as a liquid, investment-grade asset. If a rarity's ordinary printing cannot clear a $20 raw floor after years on the shelf, that is the market pricing the mechanic, not an oversight in the filter.
What this study does not say
Restraint is the price of publishing measurements, so here is the honest boundary of these results:
- It does not isolate rarity from era. The two are collinear in this data, and the rarity label itself is not even constant across eras - a 1999 "Holo Rare" and a 2019 "Holo Rare" are different products. Every cross-rarity comparison should be read partly as an era comparison, which is exactly why rarity underperforms era as a predictor here.
- The extreme buckets are small. Gold Star (13) and Shining (14, omitted) carry wide error around their headline returns; treat the top and bottom rows as directional, not precise.
- Survivorship runs one way, and it cuts against the newest tier. Only cards still clearing our sales gate in 2026 enter the pool, and that culls the oldest tiers most - exactly the tiers that top the table - so read the era gap as an upper bound, not a point estimate. Rainbow, the youngest bucket, is the least survivorship-flattered of all, which makes its last-place ranking partly a comparison artifact.
- One window, one crash. The 2021 start sits near a bubble top, and it sits nearest to release for the youngest rarities, so their decline blends pandemic froth with release-hype decay that vintage tiers cannot carry. A different entry point can reorder the middle of the table.
- Market prices, not investor returns. Nothing here includes fees, shipping, spread or taxes, and raw pricing is sparse enough that these drawdowns are, if anything, understatements.
- Raw Near Mint is a band, not a point. The same "NM" sale can grade anywhere from PSA 6 to 10, and that mix drifts over time as demand pulls the sharp copies out into slabs. Graded pricing is the sharper instrument and would tighten every figure below. We use raw because it is the larger, more liquid population and the one most readers actually hold.
There is no discretionary step in this study. A card is in or out by rule alone, and the rules were fixed before any returns were seen. A card qualifies only if it clears four objective gates: (1) a liquidity gate of at least 15 raw sales in the last 180 days; (2) a price floor of a $20-or-higher raw median; (3) a history gate of a continuous monthly PriceCharting sold-price series covering at least 54 of the 66 months from 2021-01 to 2026-06, starting by 2021-03 and running to at least 2026-04; and (4) an artifact filter that drops any card with an implausible single-month price jump (over 200%) and requires at least 24 clean monthly moves. One printing per card is used, chosen by a fixed rule - the variant with the deepest continuous history - so the winning printing cannot be cherry-picked. Every card that clears all four gates is included; nothing is hand-selected.
Cards are then grouped by the rarity field on the card (Rare Holo Star = Gold Star, Rare Ultra = full-art Ultra Rare, Rare Holo EX = EX, and so on); buckets with fewer than 13 qualifying cards are omitted, as are the modern V/VMAX/VSTAR/Double-Rare tags, which had too few members clearing the raw floor to measure - and we make no return claim about any omitted tier. Metrics: returns are monthly sold-price medians; CAGR annualizes first-to-last; max drawdown is each card's own peak-to-trough; Calmar = CAGR / |max drawdown|; group figures are per-card medians. Every number here was computed from the database this site runs on and reproduces at zero deviation on re-run; each figure can be sanity-checked against any card page's own history chart.
FAQ
Which Pokemon rarity held value best from 2021 to 2026? By risk-adjusted return, Gold Star cards (+30.7% per year, Calmar 0.73, on just 13 cards) and full-art Ultra rares (+25.2%) led, with plain EX holos close behind (+22.8%). But every leader is a pre-2016 print, so the ranking reflects era as much as rarity - the strongest single takeaway is the era gradient, not any one rarity's top spot.
Are Rainbow rares a good investment? Over this window they posted the lowest annual return of any rarity we measured: +9.7% per year. Their -57% fall was actually shallower than the commons that beat them on return, so the issue was weak appreciation, not a uniquely deep crash. As raw singles across these five years, the premium the modern chase tier commands was not rewarded.
Do rarer Pokemon cards hold value better? Not in this data. The printed rarity label was a weak predictor of return, and the gap that appeared tracked print year, not how rare a card looks. It echoes our raw-vs-graded finding that scarcity alone was not linked to protection.
Why aren't V, VMAX and VSTAR cards in the study? As raw singles, almost none clear the $20 liquid floor, so they were filtered out rather than measured. The base mechanic cards trade cheaply; the value concentrates in their alternate-art and secret versions, which carry the Ultra Rare tag instead.
Did any rarity avoid the crash? No. Even the best-holding rarity, Gold Star, fell 47% from its peak, and most tiers fell 55-69%. The differences are in how much each rarity returned for the fall it took, not in whether it fell.
Where this leaves a holder
We publish measurements, not instructions, so the closing observations are exactly that:
Over this five-year window, the rarity printed on a raw single told you little about how it held value, and what signal existed pointed away from the pack-opening instinct: the premium modern chase tier returned the least, while older, plainer cards held up at least as well. But the honest engine underneath the ranking is the calendar, not the rarity stamp - hold the Pokemon constant, as the two Charizards do, and it is the print year that moves the number. Whatever the market had already agreed was special - the most famous name, the scarcest era, the flashiest label - is not where the return lived.
The five-year window is one regime. What the same market is doing right now sits on our public deal signals ledger, entry by entry with outcomes on the record, and every signal posts to a free Telegram channel the moment the engine flags a card trading below its own recent level. The raw vs graded vs sealed study covers the asset-format half of this picture. Between them, the theme of this article is checkable in public, which is where we prefer our claims to live.