
On cards that sell every day, yes, within a few percent of every other app. In our check of seven cards, Collectr's prices ran from 3% below to 25% above what those cards actually sold for over the previous 180 days, with a median of 6.5% above. Three cards showed the identical price in Collectr and Pokedata, to the cent.
On vintage cards that rarely sell, no app is accurate, because there are not enough sales to anchor a price. That is where the two apps disagreed by 50% on one card.
The bigger gap is not Collectr versus Pokedata. It is both apps versus the price a buyer really paid.
- Collectr versus completed US sales, seven cards: 3% below to 25% above, median 6.5% above, six of seven above.
- Pokedata versus completed US sales, same seven cards: 33% below to 25% above, median 6.5% above.
- Cards where Collectr and Pokedata showed the same price to the cent: 3 of 7.
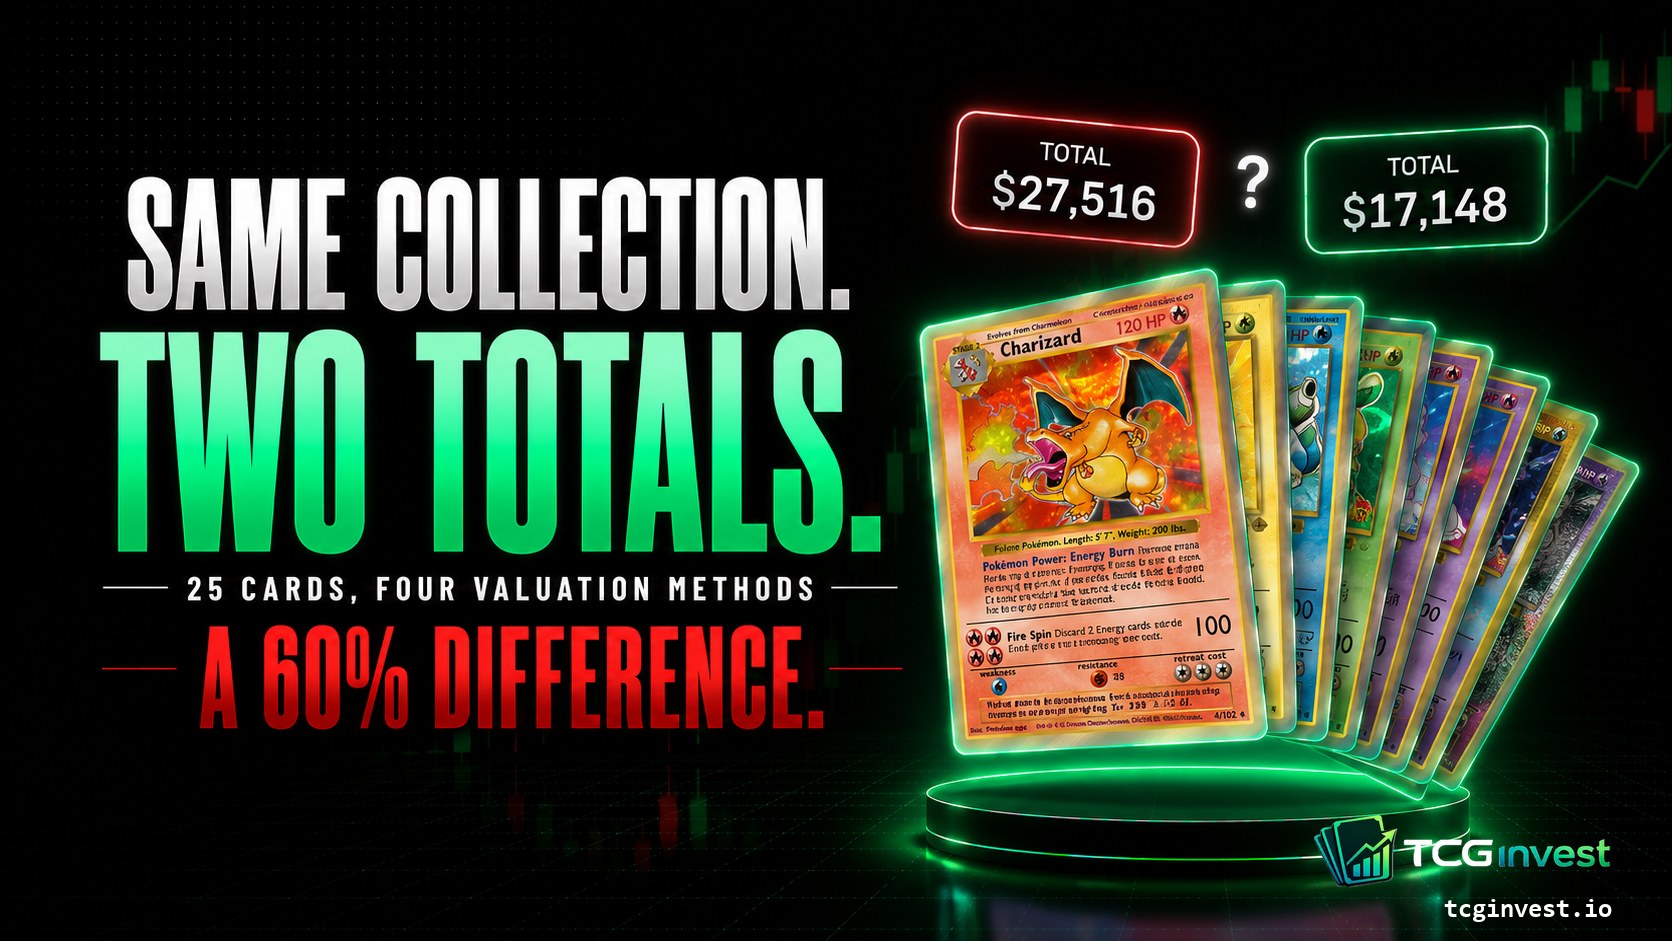
- One identical 25-card collection valued four legitimate ways: $17,148 to $27,516, a 60% spread.
- Median Pokémon card price in Europe versus the US, across 3,370 cards: about 31% lower in Europe.
Source: TCGinvest (tcginvest.io), daily prices from Cardmarket, TCGplayer and PriceCharting, plus the count of completed sales behind each figure.
Is Collectr accurate? Seven cards against real sales
The question people actually type is "is Collectr accurate", so we start with the direct test. We looked up ten cards in Collectr and in Pokedata, logged in, and put each app's displayed price next to the median of completed US sales for that card over the previous 180 days. The cards were chosen to span modern and vintage, liquid and thinly traded. The goal was not to audit every price in the apps. It was to see whether the same cards produce materially different answers, and how far each answer sits from a real sale.
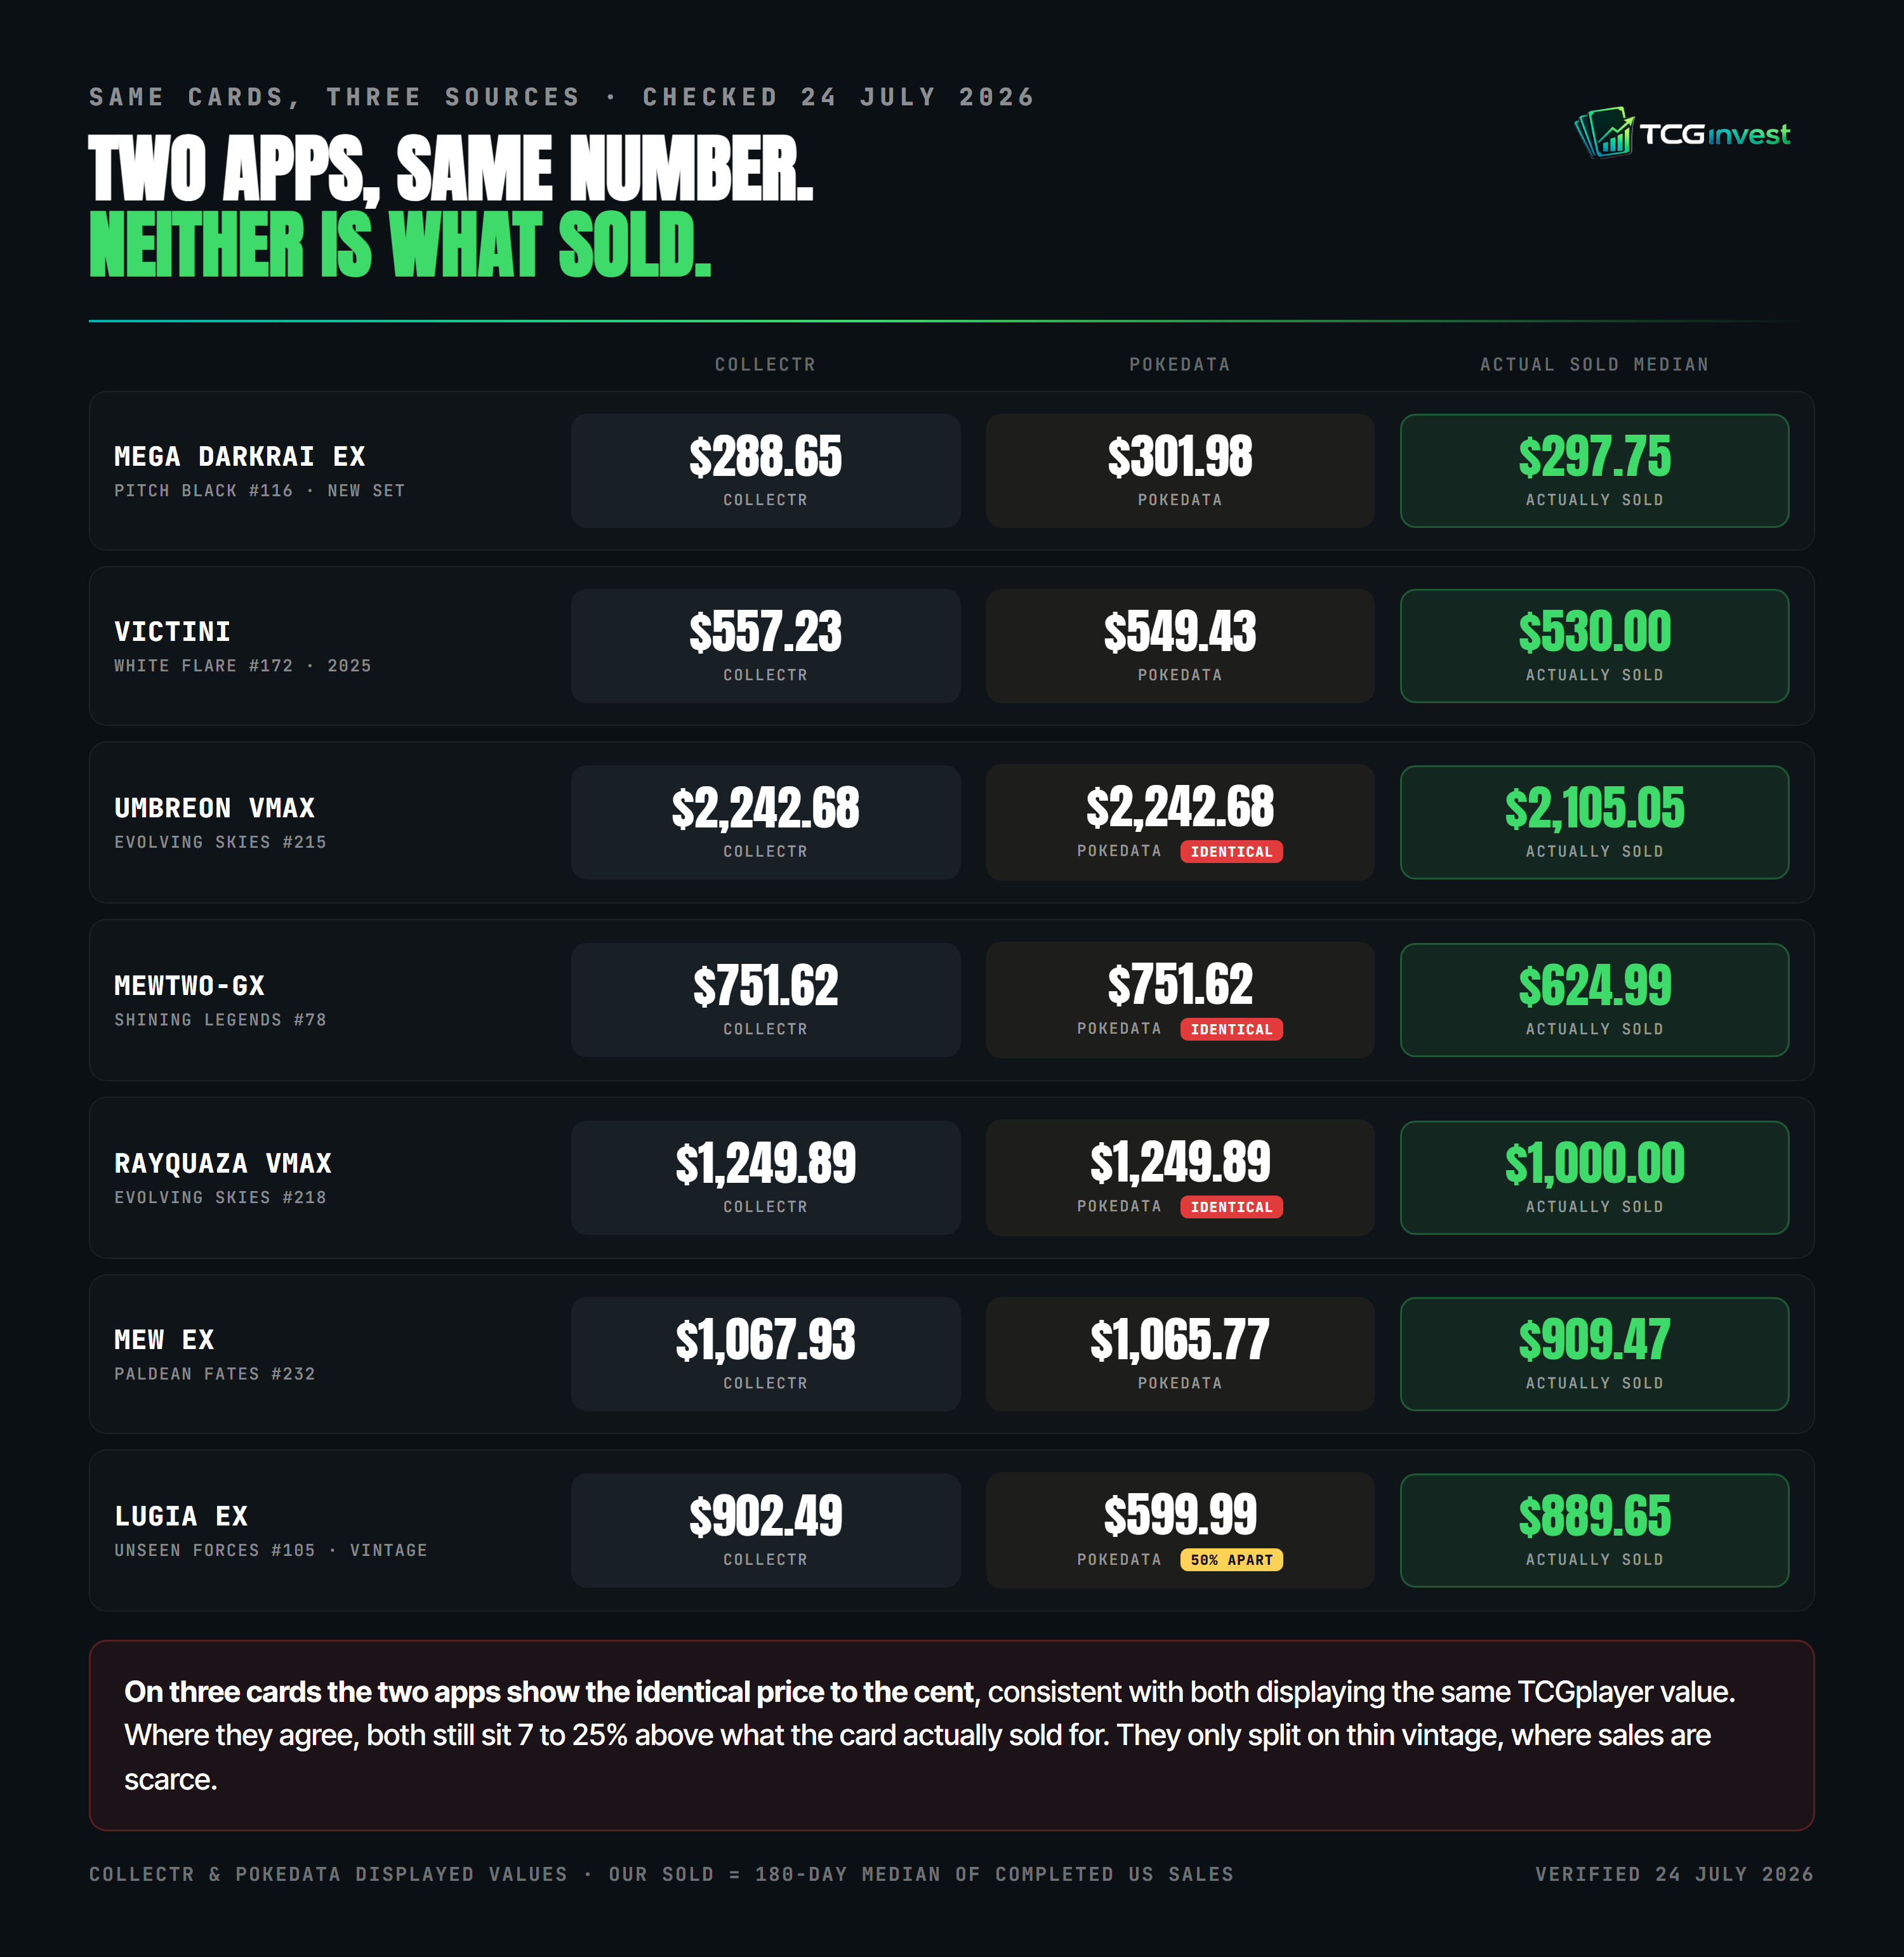
Seven of the ten, with the completed-sales median and how far Collectr sat from it:
| Card | Collectr | Pokedata | Median of completed US sales | Collectr vs sold |
|---|---|---|---|---|
| $288.65 | $301.98 | $297.75 | 3.1% below | |
| $557.23 | $549.43 | $530.00 | 5.1% above | |
| $2,242.68 | $2,242.68 | $2,105.05 | 6.5% above | |
| $751.62 | $751.62 | $624.99 | 20.3% above | |
| $1,249.89 | $1,249.89 | $1,000.00 | 25.0% above | |
| $1,067.93 | $1,065.77 | $909.47 | 17.4% above | |
| $902.49 | $599.99 | $889.65 | 1.4% above |
The result was not what "Collectr vs Pokedata" implies. On three of the cards, the two apps showed the identical price to the cent (Umbreon VMAX at $2,242.68, Rayquaza VMAX at $1,249.89, Mewtwo-GX at $751.62). For those cards, choosing between the two apps made no practical difference. That result is consistent with both apps displaying the same underlying TCGplayer value for those cards.
The bigger gap was not between the apps. It was between both apps and completed sales. Six of the seven Collectr prices sat above the 180-day completed-sale median. Where the two apps agreed to the cent, they still sat 7 to 25% above it. Whatever the displayed figure is built from, on these cards it consistently landed above the middle of recent completed sales.
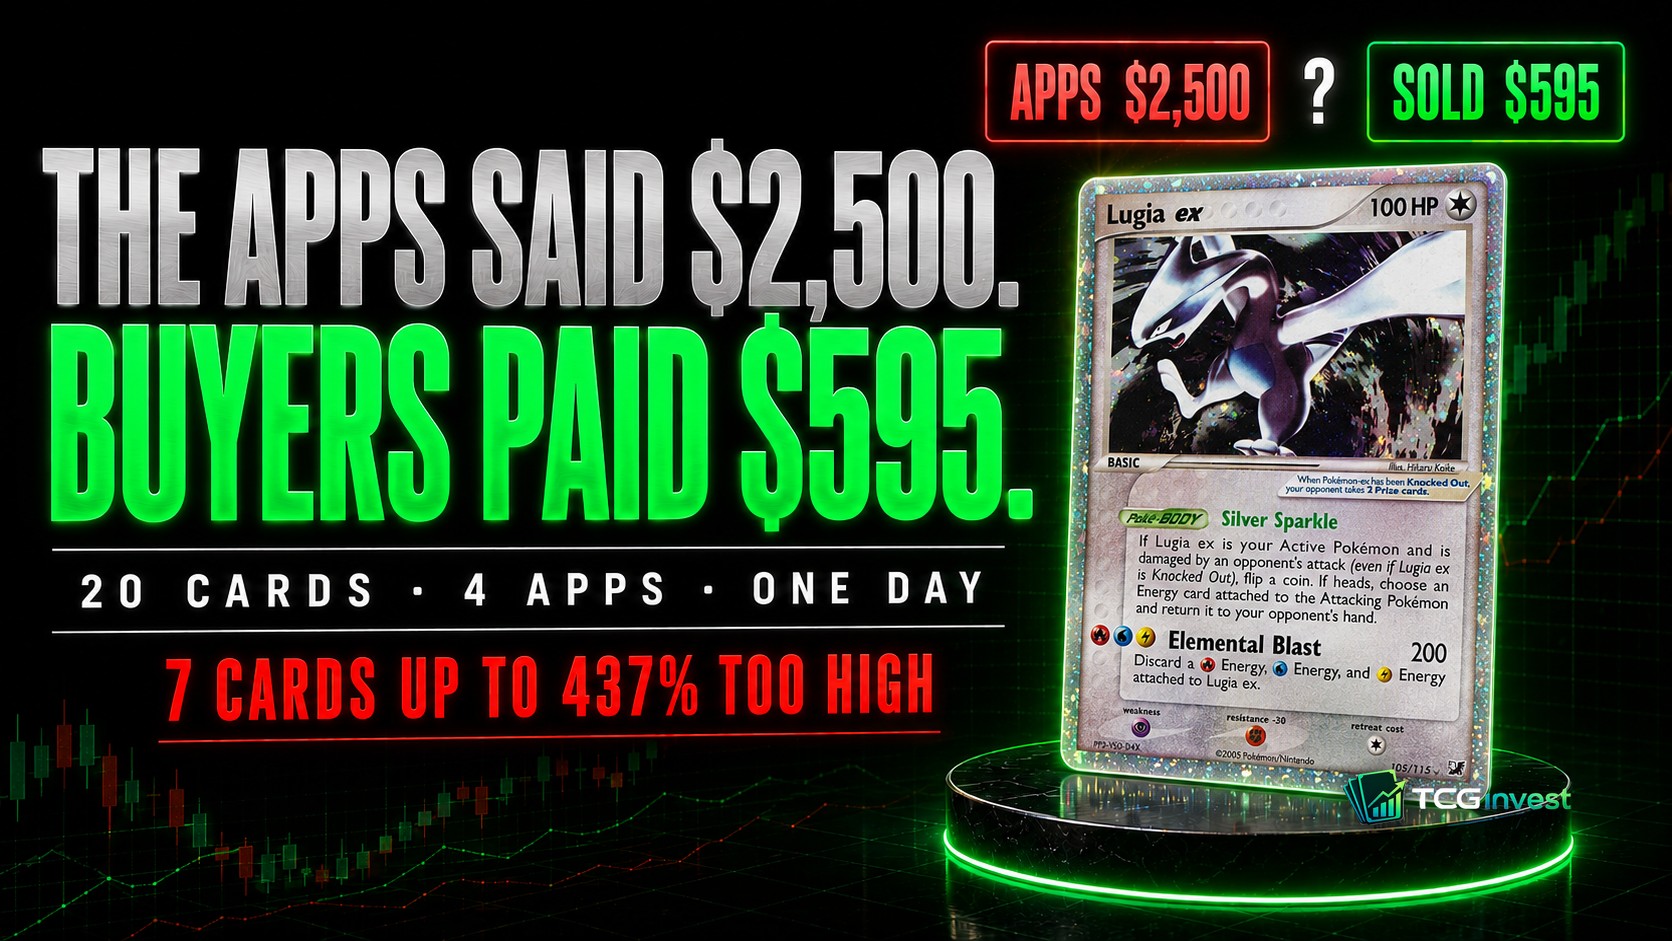
They only genuinely disagreed on the vintage card. Lugia ex from Unseen Forces: Collectr $902, Pokedata $600, a 50% gap on the same card. Exactly where the sales dry up, exactly as the rest of this article predicts. On that card Collectr was the closer of the two, within 1.4% of the sold median, while Pokedata sat 33% under it.
Every card page on TCGinvest shows the Cardmarket price for Europe, the TCGplayer price and the PriceCharting completed-sales median for the US, each labelled by source, with the number of completed sales behind it. Free, no account needed. Search any card on TCGinvest and compare it with what your app shows.
How does Collectr price cards?
Collectr does not publish a formula, so nobody outside the company can say exactly how a displayed price is built. What we can say comes from two places.
What Collectr says. Its own site describes the product as showing live auctions and fixed-price listings from eBay and TCGplayer side by side, with raw and graded prices, population reports and sold listings. That tells you the inputs. It does not tell you which of them becomes the number on your collection total.
What we measured. On three of seven cards, Collectr's price and Pokedata's price were the same to the cent. Two independent apps do not land on $2,242.68 by coincidence. The simplest explanation is that both display the same third-party value for those cards, and the figure matches the shape of a TCGplayer market price: a modelled estimate of the current price, not the median of what buyers paid. That fits the pattern in the table, where the displayed figure sat above completed sales on six of seven cards.
So the practical answer to "where does Collectr get its prices" is: from US marketplace data, displayed as a market-style estimate in US dollars. The practical consequence is in the next section.
Why are Collectr prices so high?
Three reasons, and none of them is a bug.
A market price is not a sale. A modelled estimate leans on current listings and recent activity. The median of completed sales is the middle of what buyers actually paid. On our seven cards, the displayed price sat above the sold median by a median of 6.5%, and by 20 to 25% on Mewtwo-GX and Rayquaza VMAX. If your total feels high next to what you could sell for, this is most of the reason.
Thin cards have no crowd. Where a card sells constantly, every pricing method converges. Where it sells thirty times in six months, one optimistic listing moves the number a long way. Our whole-dataset measurement below puts a figure on this: cards with fewer than 31 completed sales show a 2.46x median gap between the highest and lowest pricing method.
You may be in the wrong market. The figures we logged were US-dollar values. Across the 3,370 Pokémon cards we can price on both continents, the median card sells for about 31% less in Europe than in the United States. A European collector looking at a US-dollar total is looking at a number that is roughly a third above what Cardmarket would pay, before any methodology difference enters.
When people search "Collectr prices wrong", the Lugia ex case is usually what they mean: a vintage card where two apps disagree by 50%. That is a thin-market problem, not a Collectr problem, and the same thing happens in every tracker on the same cards.
The experiment
Collectr and Pokedata are the two apps we get asked about most, but the same issue affects almost every collection tracker, so we took the apps out of it entirely.
We took 25 well-known Pokémon cards (Charizards, Umbreon VMAX, Lugia, Shining Mewtwo, Pikachus), the kind of collection a serious hobbyist actually owns. One identical basket. Then we valued it four different ways, using four price types that real tools really use.
Every method below is legitimate. Every one is used in production by somebody.
| Method | What it measures | This collection is worth |
|---|---|---|
| Lowest ask (EU) | The cheapest Near Mint English copy listed on Cardmarket right now | $27,516 |
| Modelled estimate (US) | A blended point estimate of the current price | $19,670 |
| Median of completed sales (US) | What buyers actually paid, 180-day median | $21,350 |
| Trend line (EU) | Rolling average of recent Cardmarket listings | $17,148 |
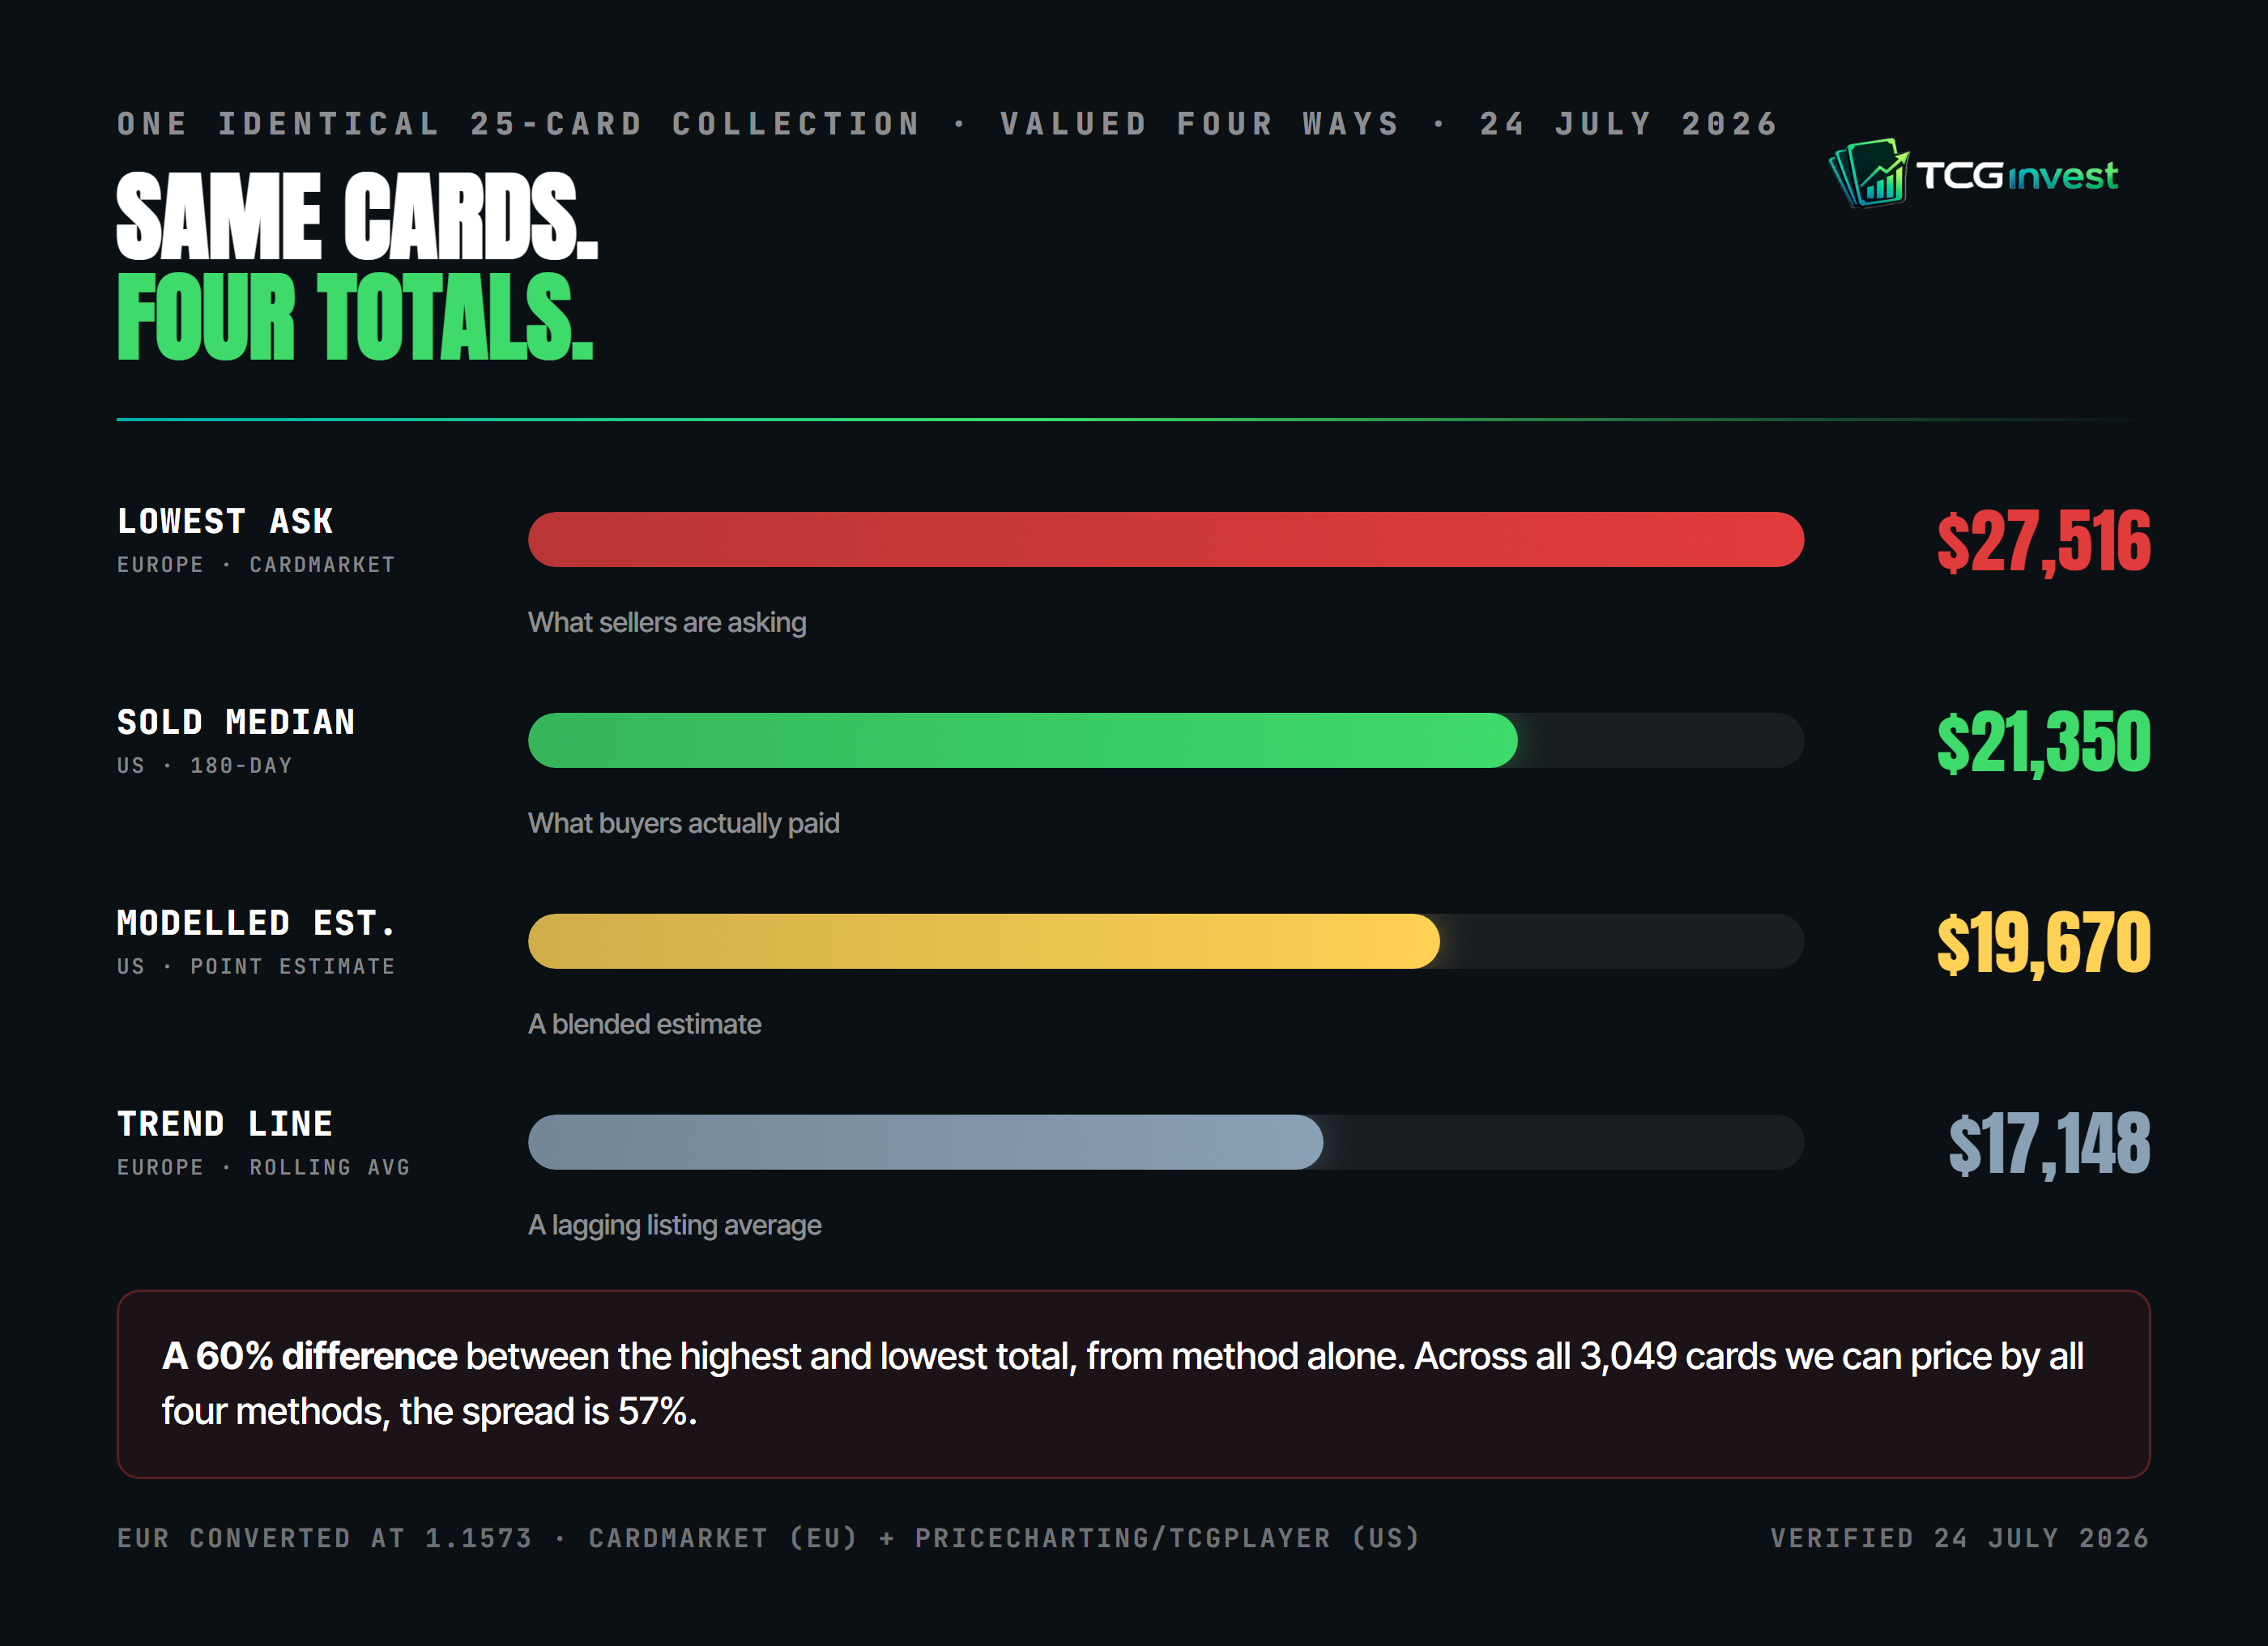
The same 25 cards. The same day. A 60% difference between the highest and lowest total.
Widen it out and the pattern holds: across all 3,049 cards we can price by all four methods simultaneously, the same basket comes to $136,241 or $213,270 depending on method, a 57% spread. This is not a quirk of the cards we picked.
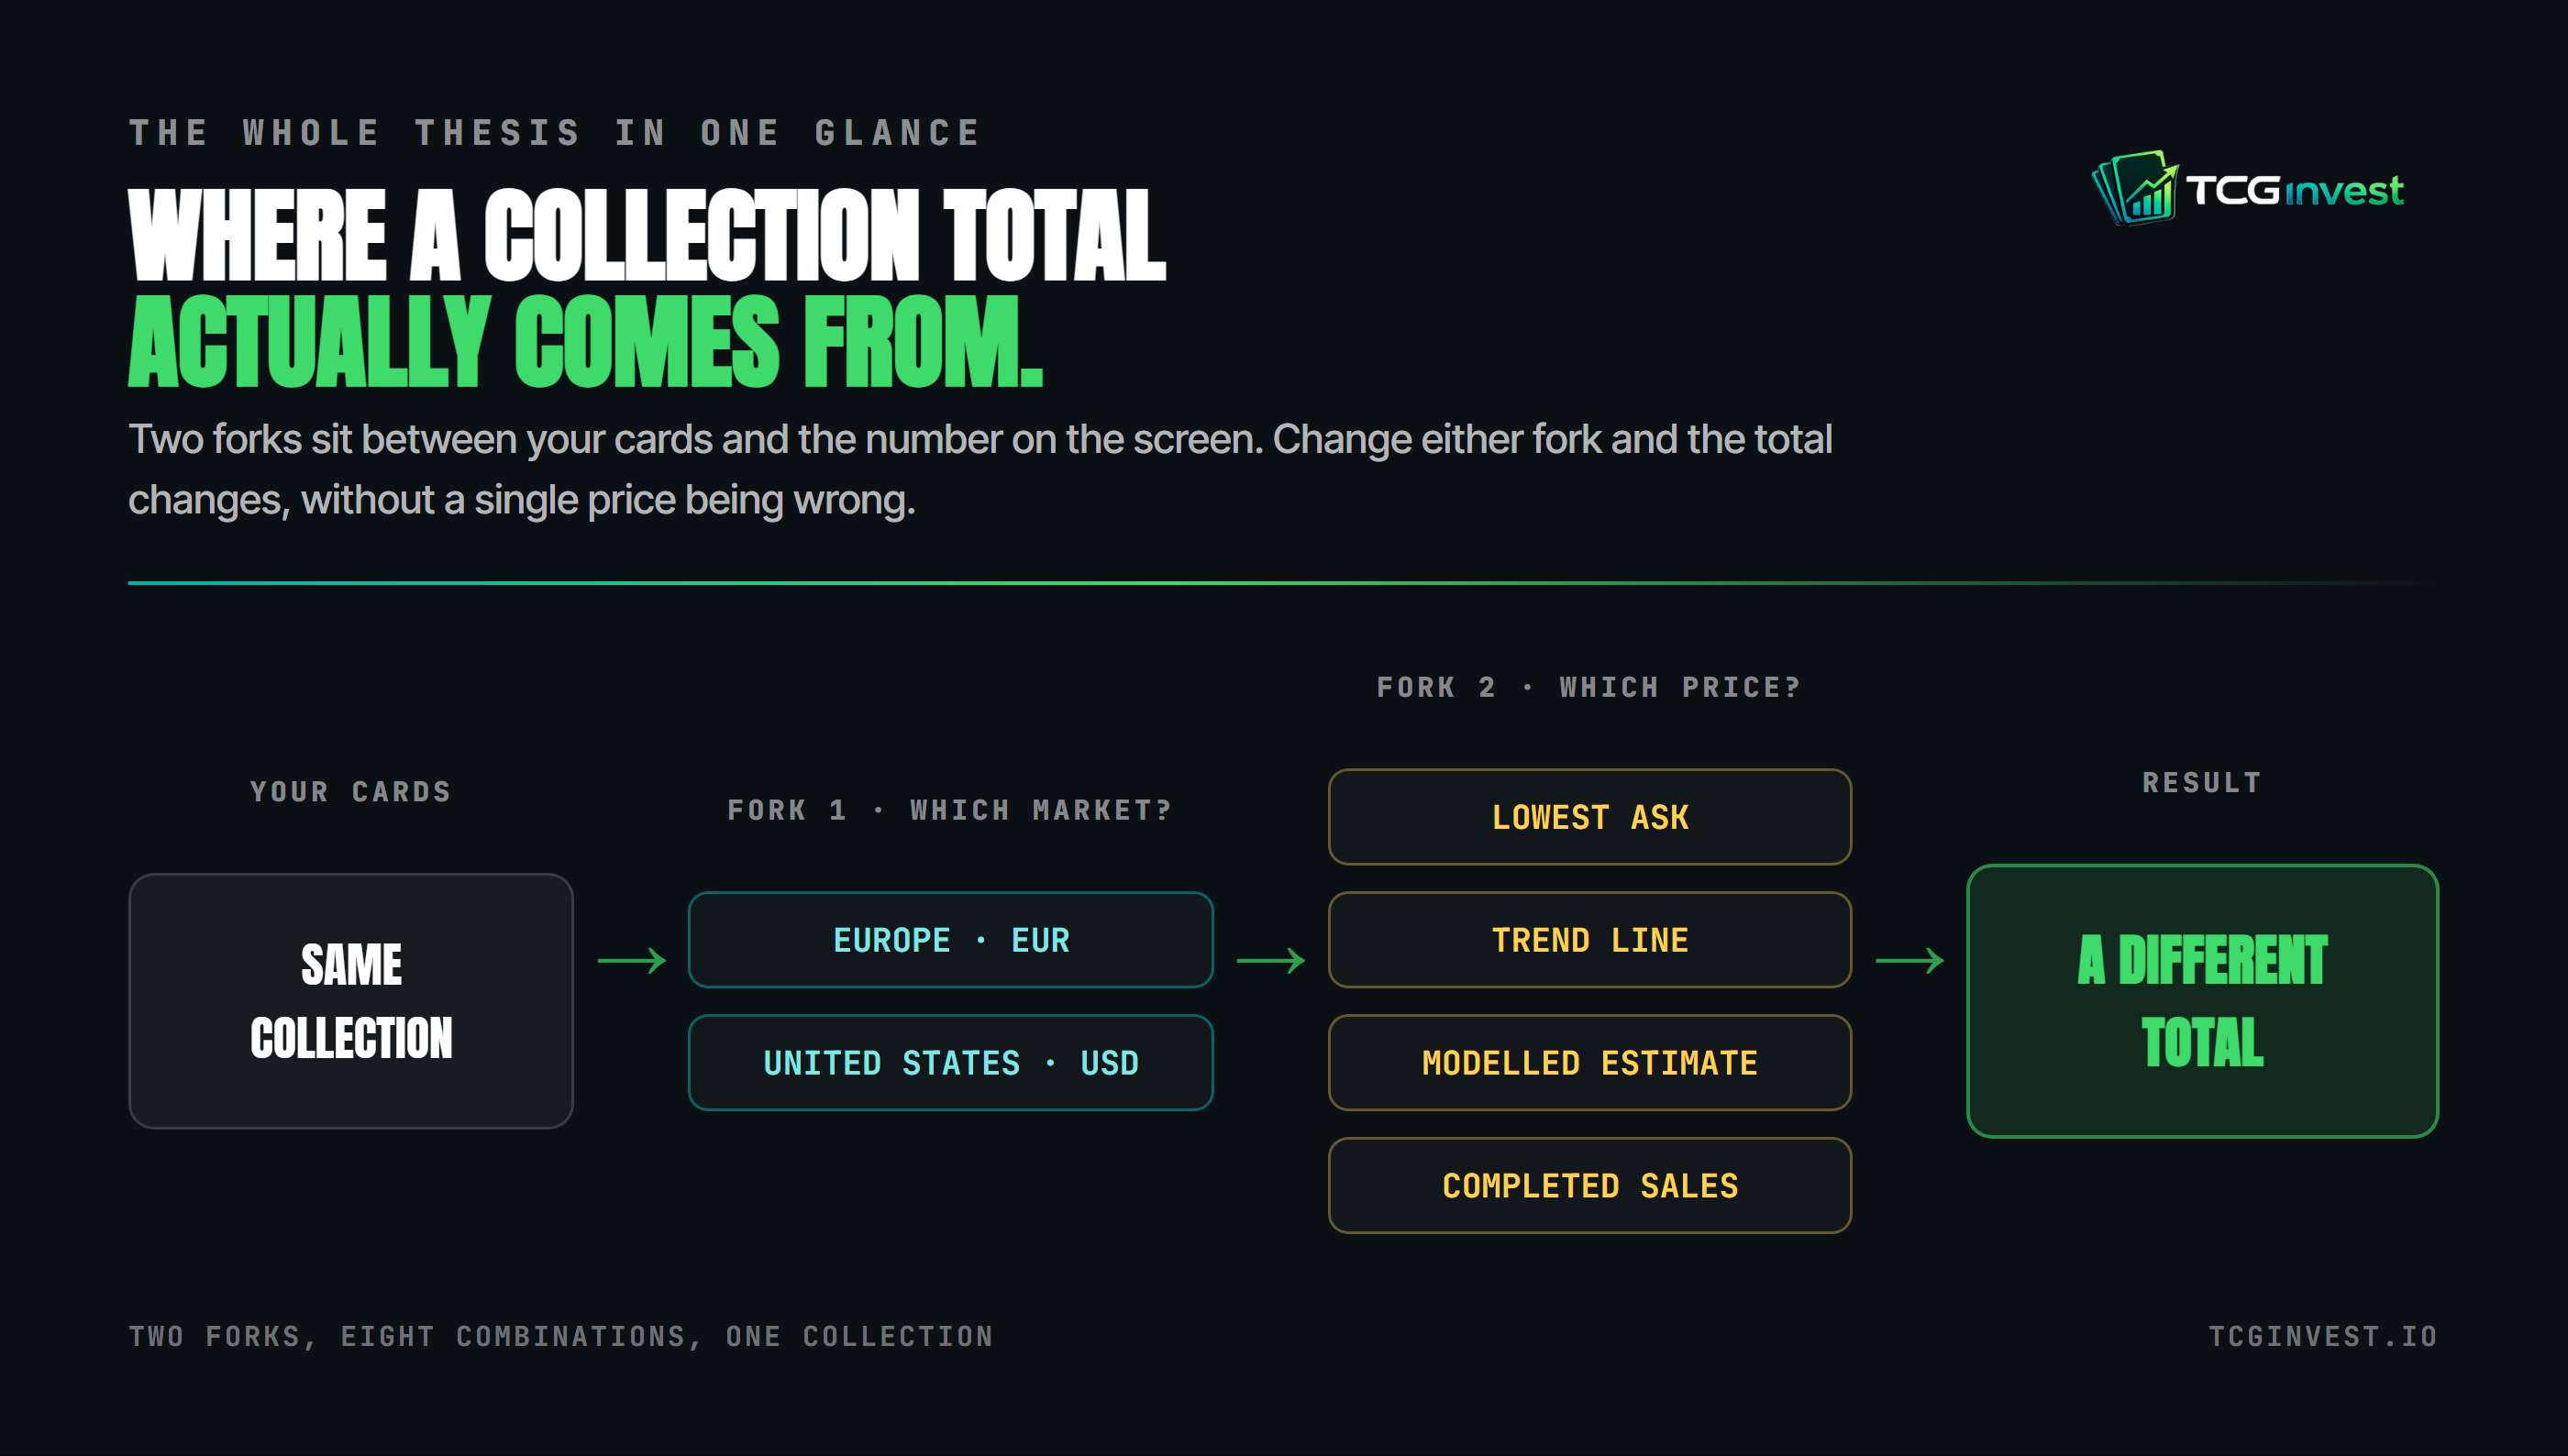
Two forks sit between your cards and the number on the screen: which market, and which price. Change either one and the total changes, without a single price being wrong.
Why the gap exists
An asking price is not a sale. A trend line is not today. A modelled estimate is not a receipt.
| Price type | What it really is |
|---|---|
| Lowest ask | The cheapest current listing. A listing is not evidence that a buyer paid that amount. |
| Trend line | A rolling average over a recent window. It reacts slowly, so it can sit far from today's market. |
| Modelled estimate | A blended point estimate built from recent market data. |
| Median of completed sales | The middle of what buyers actually paid. Money that changed hands. |
An app showing you $27,516 and an app showing you $17,148 are not contradicting each other. One is totalling what sellers want. The other is totalling a lagging average.
The part that decides how big your gap is
Here is what most comparisons miss: the disagreement is not evenly spread across your collection. It concentrates almost entirely in cards that rarely sell.
Two cards from the same basket:
Umbreon VMAX, Evolving Skies #215. 60 completed sales behind it.
| Method | Value |
|---|---|
| Lowest ask (EU) | $2,025 |
| Trend (EU) | $1,828 |
| Modelled (US) | $1,994 |
| Sold median (US) | $2,105 |
All four land within about 13% of each other. When a card trades constantly, every method converges, because they are all describing the same busy market.
Lugia ex, Unseen Forces #105. 30 completed sales, a card printed in 2005.
| Method | Value |
|---|---|
| Lowest ask (EU) | $1,157 |
| Trend (EU) | $333 |
| Modelled (US) | $380 |
| Sold median (US) | $890 |
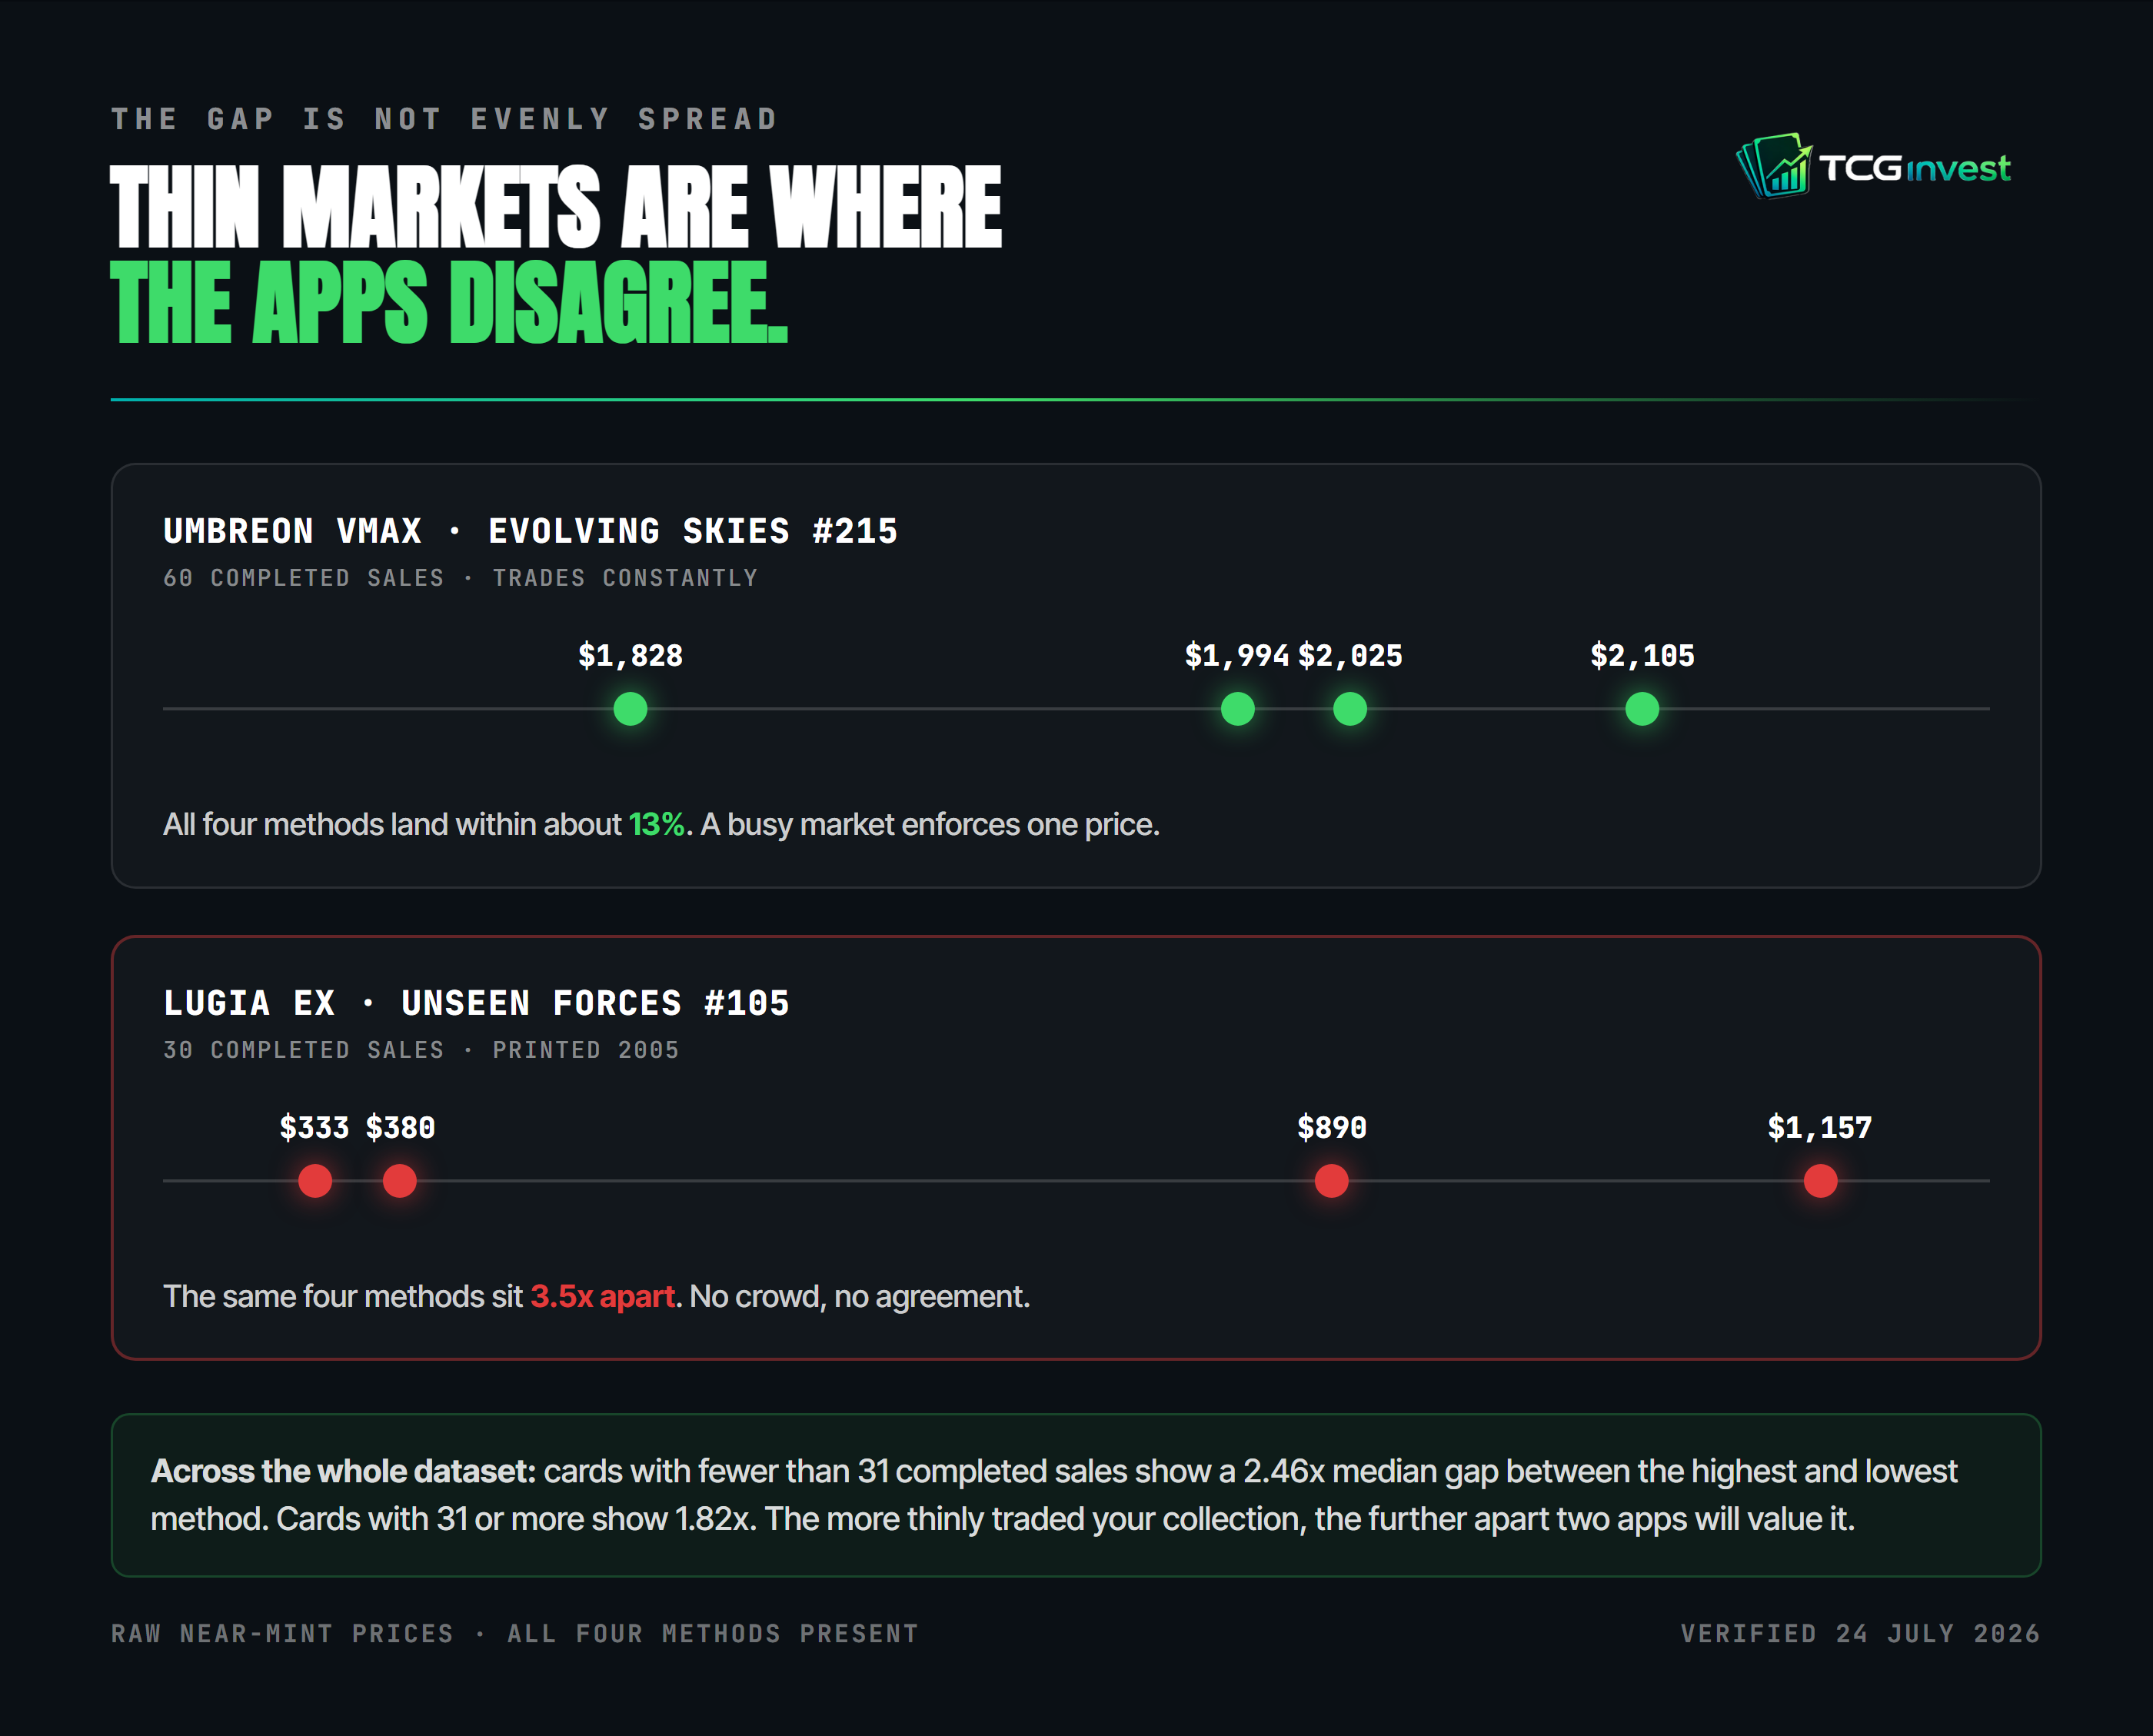
Same four methods. 3.5x apart. Nothing is broken here either. There is simply no crowd enforcing a price, so one optimistic listing and one lagging average pull in opposite directions.
We measured this across the whole dataset in our study on why price sites disagree: Pokémon cards with fewer than 31 completed sales show a 2.46x median gap between the highest and lowest pricing method. Cards with 31 or more show 1.82x.
So the practical rule: the more vintage and thinly-traded your collection is, the further apart different pricing methods become. Apps that rely on different methods will naturally produce different totals. A modern collection of heavily-traded chase cards will look roughly the same everywhere. A vintage collection will not.
The second reason: two continents
Three of the four numbers above started in euros and one in dollars, and converting between them does not make them comparable, because Europe and the US are genuinely different markets.
Across the 3,370 Pokémon cards we can price in both, the median card sells for about 31% less in Europe than in the United States. An app pricing your collection off European data and an app pricing it off US data will disagree by roughly a third before any methodology difference even enters.
There is a limit to that measurement worth stating: the European figure comes from Cardmarket's 30-day average, which includes every language and condition sold, so it sits below a Near Mint English copy. Treat 31% as the widest reasonable reading of the gap, not a like-for-like figure.
Collectr vs PriceCharting vs TCGplayer: which is closest to a real sale?
The three names people compare are not three opinions about the same thing. They are three different price types, and the table in the experiment above already contains them.
| Source | What the number is | Closest to a real sale? |
|---|---|---|
| PriceCharting | Built from completed sales. Our "median of completed sales" is the 180-day median of the sold listings PriceCharting records. | Yes. It is the sale. |
| TCGplayer market price | A modelled estimate of the current price, blended from recent market data. | Usually a little above the sold median. |
| Collectr (displayed price) | Not published. On our seven cards it behaved like a market estimate and matched a TCGplayer-style value to the cent on three of them. | Same as TCGplayer where they match, 7 to 25% above the sold median. |
So "is Collectr or PriceCharting more accurate" has a clean answer once you say accurate at what. If you want to know what a card would actually sell for, a completed-sales figure is closer, and PriceCharting is a completed-sales figure. If you want a smooth number that does not jump every time one copy sells, a modelled estimate is more comfortable, and it will sit a little high.
"Is Collectr or TCGplayer more accurate" mostly dissolves: on three of seven cards they were, as far as we can tell, the same number.
We ran the bigger version of this test in September 2026: 20 cards, four apps, one day, against the median completed sale. The apps matched TCGplayer within 1% on 16 to 18 of the 20 cards, and on seven vintage cards all of them showed 46% to 437% more than buyers paid.
Does Collectr use European prices?
The prices we logged in Collectr in July 2026 were US-dollar figures that matched US marketplace values. We did not find a Cardmarket-based figure in what we saw. If your app has a European mode we did not test, the rest of this section still applies to any US-dollar total.
For a collector in Europe that matters more than any methodology question. The median card sells for about 31% less on Cardmarket than in the US. A collection showing $10,000 in a US-dollar app is, at the median, a collection that would fetch closer to €6,000 to €6,500 if sold on Cardmarket today, before fees. The number is not wrong. It is answering the question "what is this worth in the United States", which is not the question a European seller is asking.
That is why we show both markets on every card, labelled, rather than converting one into the other.
How to read your own collection total
- Ask, or completed sale? An ask is what someone wants. A sale is what someone paid.
- How many sales is it built on? A median from 60 sales is dependable. A median from 3 sales is an anecdote wearing a fact's clothing.
- Which market? A euro price and a dollar price on the same card are two different markets, not one number in two currencies.
If an app cannot tell you which of those three it used, its total is a number without a question attached.
What we do about it
At TCGinvest, we show Cardmarket data for Europe alongside PriceCharting and TCGplayer data for the US, with each figure labelled by source and method, and the sales count shown next to it. Collapsing them into one number would throw away the most useful thing about having both. Where a card's data is too thin to trust, we show a dash rather than invent a number.
That is the only real defence: say which question you are answering, and show your sample size.
Add your cards to a free TCGinvest portfolio and the total is shown for Europe and for the US separately, with the completed-sales count behind every card. No single number pretending to be the truth. Start a free portfolio.
Frequently asked
Is Collectr accurate for Pokémon cards?
On cards that trade often, yes, within a few percent of other apps. In our July 2026 check of seven cards, Collectr's displayed prices ranged from 3% below to 25% above the median of completed US sales over the previous 180 days, with a median of 6.5% above. Six of the seven sat above the sold price. On thinly traded vintage cards, no app is dependable, because there are too few sales to anchor a price.
How does Collectr price cards?
Collectr does not publish a pricing formula. Its own site says it shows live auctions and fixed-price listings from eBay and TCGplayer alongside sold listings. In our check, three cards showed exactly the same price in Collectr and Pokedata to the cent, which is consistent with both apps displaying the same TCGplayer market value for those cards.
Why are Collectr prices so high?
Because a market-style price is not the same as what buyers actually paid. On six of seven cards we checked, Collectr's figure sat above the 180-day median of completed sales, by up to 25%. For European collectors there is a second reason: the figures are US-dollar values, and the median Pokémon card sells for about 31% less in Europe than in the United States.
Is Collectr or PriceCharting more accurate?
They answer different questions. PriceCharting's figures are built from completed sales, so they describe what buyers paid. Collectr's displayed prices, on the cards we checked, behaved like a market estimate and sat 7 to 25% above the completed-sales median on the three cards where Collectr matched TCGplayer to the cent. If you want to know what a card would sell for, a completed-sales figure is closer.
Is Collectr or TCGplayer more accurate?
On three of seven cards, Collectr showed the same price as Pokedata to the cent, consistent with both apps displaying TCGplayer's market value. Where that is the case there is nothing to choose between them; both sit above what the cards actually sold for. TCGplayer's market price is a modelled estimate, not a receipt.
Is Pokedata accurate?
About as accurate as Collectr on liquid cards. In our seven-card check, Pokedata ranged from 33% below to 25% above the completed-sales median, with the same 6.5% median premium as Collectr. The one large miss was a 2005 Lugia ex, where Pokedata showed $600 against $890 of completed sales. Collectr was within 1.4% on that card.
Why do Collectr and Pokedata show different values for the same collection?
Often they do not. Three of seven cards showed exactly the same price in both apps. When totals differ, it comes down to the price method (asking price, trend line, modelled estimate, or median of completed sales) and the market (Europe or the US). Those two choices alone move an identical 25-card collection between $17,148 and $27,516. The larger gap is usually not app versus app, it is app versus what the cards actually sold for.
Does Collectr use European (Cardmarket) prices?
The prices we logged in Collectr in July 2026 were US-dollar figures that matched US marketplace values. Our data shows the median Pokémon card sells for about 31% less on Cardmarket in Europe than in the US, so a US-dollar total overstates what a European collection would fetch on Cardmarket by roughly a third before any methodology difference.
Which value should I trust for insurance or selling?
For selling, the median of completed sales is the closest thing to what a buyer will actually pay. For insurance, replacement cost is closer to the asking price, since that is what you would pay to buy the card back. They are different questions with different correct answers.
Why is the gap bigger on my vintage cards?
Thin markets. Cards with fewer than 31 completed sales in our dataset show a 2.46x median gap between pricing methods, against 1.82x for cards with more. Fewer sales means each individual listing moves the number more.
See it yourself: every card page on TCGinvest.io shows the European (Cardmarket) price and the US (TCGplayer and PriceCharting) price side by side, each labelled by source and shown with the number of completed sales behind it.
TCGinvest measures prices daily from Cardmarket (EU) and PriceCharting/TCGplayer (US). The 25-card basket and the 3,049-card universe both require all four price types present, at least 8 completed sales, and exclude 1st Edition printings. EUR converted at 1.1573. The seven-card app check was made on 24 July 2026 and the app prices quoted are what the apps displayed on that day; they will have moved since. Section on Collectr's own description of its data sources added 2 September 2026. Nothing here is financial advice, and every number moves.