
We studied 47,431 Pokémon card price histories across the 2022 crash and the 2023–24 recovery. The result is one of the cleanest mean-reversion patterns we've ever seen in a non-equity market — and it's the opposite of what most collectors do.
The instinct that quietly costs collectors money
Most people buy a card because it's already going up. It feels safe — the market is "confirming" it.
In our data, that was historically one of the worst-timed decisions you could make.
We're TCGinvest. We come from quant trading, and we ran the kind of test you'd run on a stock strategy — but on Pokémon cards. The result is counterintuitive, consistent, and the opposite of what hype-chasing assumes.
The question we tested
When a Pokémon card has just surged, does it keep winning — or does the market cool it off?
Simple question. Most collectors assume "it keeps winning." We checked, properly.
The finding (this is the whole article)
We sorted every card by how much it moved in the last month, then looked at what it actually did over the next 12 months. The ladder is perfectly stepped:
Read it top to bottom: every step down in recent hype = a step up in next-year return. No exceptions in the ladder. The cards everyone was excited about did the worst. The cards everyone had given up on did the best.
In plain terms: this "hot now → cold later" relationship was strong and remarkably stable — it didn't flip in the 2022 crash, didn't flip in the 2023–24 recovery, and showed up again, independently, in the PSA-10 graded market.
Curious where the cards you own land on that table? TCGinvest scores ~8,000 cards (every era, every variant) on exactly this kind of analysis — momentum, value, projected long-term ROI, buy zones — with the data shown openly. Browse the cards free →
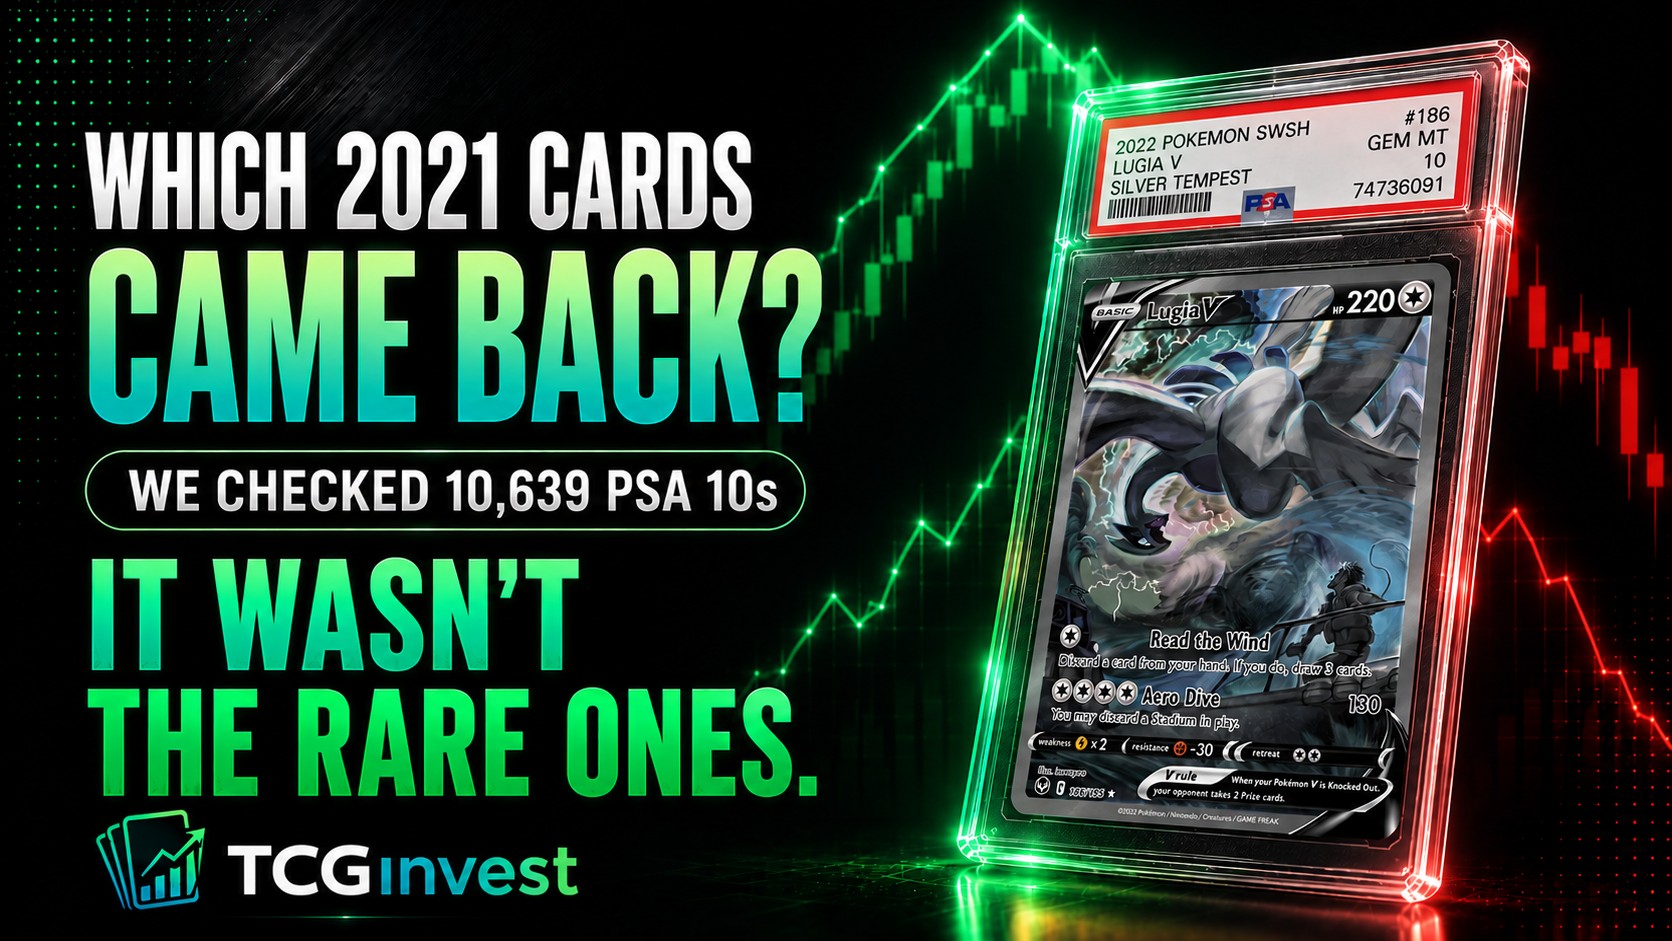
Two real cards: what the 2021 mania actually did
You don't need a chart to remember this one — most collectors lived through it. The 2020–2021 speculative boom pulled graded prices vertical, then 2022 took it back. Two examples straight from our PSA-10 data:
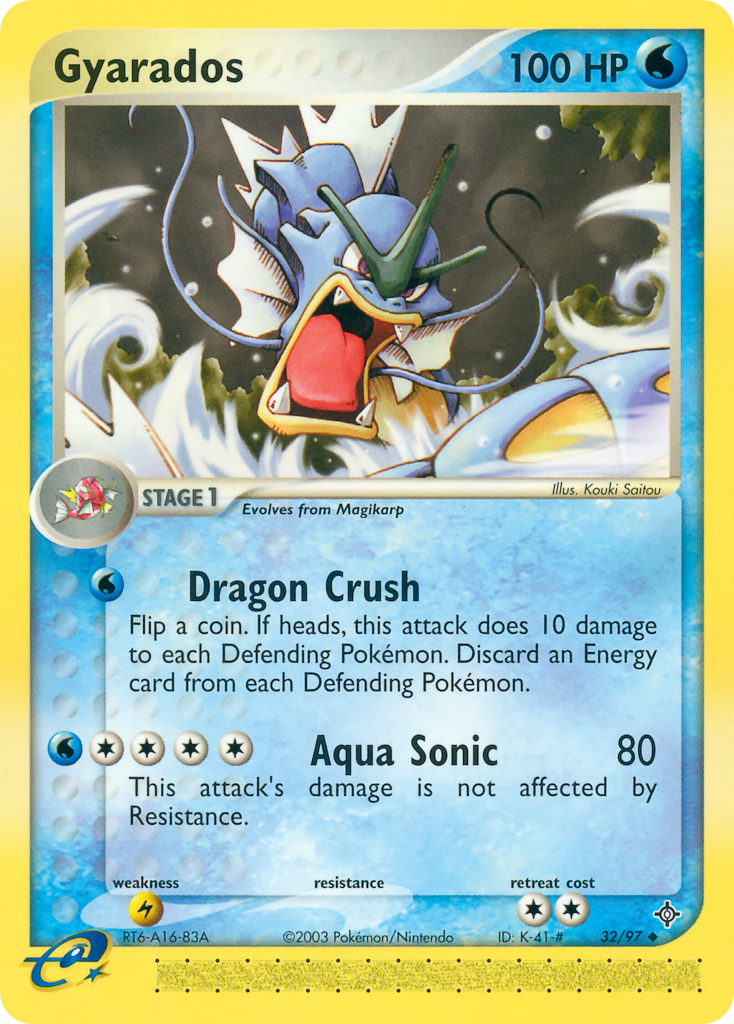
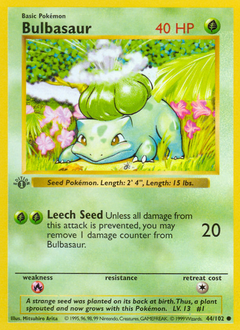
Gyarados — EX Dragon (2003), PSA 10
- Sep 2021: ≈ $604 — baseline
- Dec 2021: ≈ $2,000 (+231% in three months — the spike)
- Dec 2022: ≈ $277 (−86% over the next 12 months — the reversion)
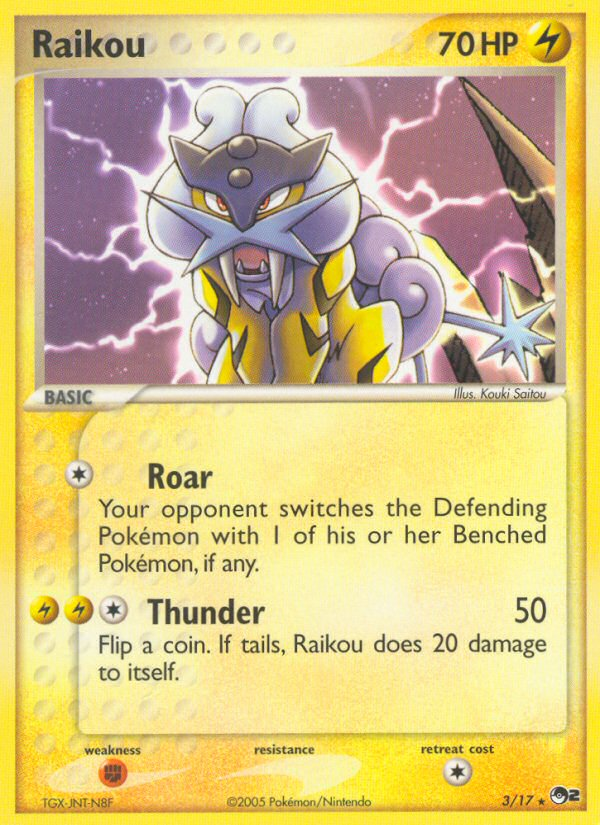
Raikou — POP Series 2 (2004), PSA 10
- Jun 2021: ≈ $326 — baseline
- Sep 2021: ≈ $1,500 (+360% — the spike)
- Sep 2022: ≈ $180 (−88% over the next 12 months)
These aren't obscure cards or cherry-picked noise — they're recognizable cards, the move is corroborated across neighboring months, and it lands exactly where the aggregate table predicts: a card sitting in the ">+20%" bucket went on to bleed out. Buying either at the top, when it felt safest, was the single worst-timed entry available.
(One honesty note: individual graded cards have thinner monthly data than the 47k aggregate, so we only cite price points corroborated by surrounding months. The aggregate table — not any single card — is the evidence; these just put a face on it.)
The psychology — and why this isn't a Pokémon thing
Here's the part that should make you take it seriously: this is one of the most documented patterns in all of finance. Pokémon isn't special — it's a textbook attention-driven market doing exactly what attention-driven markets do.
In equities, the classic reference is De Bondt & Thaler's 1985 study "Does the Stock Market Overreact?" — portfolios of the worst-performing prior stocks went on to beat the prior winners over the following years. The same family of effect shows up again and again: short-term price reversal, "glamour" stocks underperforming, lottery-type stocks overpriced, hot IPOs disappointing, momentum strategies suffering violent crashes. Different assets, same human wiring.
The drivers are behavioral, and they're identical in a card binder and a brokerage account:
- Overreaction & recency bias. People extrapolate the last move. A card up 50% feels like it'll keep going, so they pay up — past the price steady demand supports.
- Herding / FOMO. The marginal buyer in a spike is buying because everyone else is. That's the least durable demand there is.
- The disposition effect. People hold losers and dump winners — which distorts supply exactly when it matters and accelerates the snap-back.
- Narrative cycles. Hype needs a story. When attention rotates to the next set, the next chase, the next meta, the story leaves — and so does the premium.
Pokémon then adds two amplifiers a stock doesn't have:
- Physical supply responds to price. High prices physically pull cards out of collections and slabs and onto the market. The spike creates the supply that ends the spike.
- Attention is finite and rotational. The hobby has one collective spotlight and it's always moving to the newest thing — so yesterday's hot card doesn't just cool, it gets abandoned.
Nobody has to be irrational for any of this. It's the ordinary physics of a market priced by attention — and it's why the pattern was so stable across every period we tested. You're not looking at a Pokémon quirk. You're looking at a 40-year-old, well-replicated market behavior, showing up in cardboard.
How we made sure this wasn't cherry-picked
You should be skeptical of any "study" in this hobby. Ours was built to try to fail:
- No hindsight. At each test date we used only what was knowable that day.
- Losers kept in. Cards that later collapsed kept their real bad outcome — we didn't quietly delete them (the #1 way card "studies" lie).
- 5 separate time periods, spanning the 2022 crash and the 2023–24 recovery — so it can't be one lucky cycle.
- Two separate markets (ungraded NM and PSA-10), tested independently.
- ~47,000 observations, extreme outliers clipped so one bad data point can't fake the result.
It was designed to disprove the pattern. It couldn't.
What this does not mean (read this part)
The finding is strong enough that we don't need to oversell it — so here's the honest fine print:
- It's a tendency, not a law. Many individual cards don't follow it. The table is an average over thousands.
- It is not a prediction. We measured what happened 2022–2025. The future is not obligated to repeat it.
- Not every crash is a buy. Some cards fall for reasons that don't reverse. "Cooled cards recover" is a multi-year tendency, not a timing signal.
- Macro and liquidity dominate. A hobby-wide downturn or a thin-supply card can override this for a long time.
We publish the caveats because the data is solid. That's the difference between research and finance fluff.
What it means if you actually invest in cards
- Chasing a card because it's spiking was the worst-timed entry in the data. Unusually clear.
- Patience paid. Flat and cooled cards carried the returns here.
- Cool-off periods can be accumulation windows — for cards you'd want long-term anyway.
- Card quality and a long horizon still matter most. This is about timing within a hold thesis, not replacing it.
Notice what we're not doing: naming "cards to buy now" or promising a number.
How TCGinvest bakes this in
We didn't just publish this — we corrected our own model with it. TCGinvest's long-term projection applies a conservative, mildly contrarian adjustment: it trims projected enthusiasm for cards that just spiked and slightly favors cards that have stabilized. Restrained and frozen — calibrated to the structure above, not tuned to chase it.
FAQ
Do Pokémon card prices mean-revert? In our 47,431-observation study (2022–2025), yes — strongly and consistently. Cards with the strongest recent gains had the weakest forward returns; recently-cooled cards had the strongest. It held across five market periods and in both ungraded and graded markets.
Should I buy Pokémon cards that are going up? Historically, buying because a card was spiking was the worst-timed entry we measured (the +20% group averaged −2% over the next year). That's a tendency, not a guarantee — but it's the opposite of what most collectors assume.
Is recently-crashed always a buy signal? No. The crashed bucket averaged +31% over the next year, but that's an average across thousands of cards. Some cards crash for durable reasons. It's an accumulation tendency for quality cards, not a blanket signal.
What data is this based on? Verified English Near-Mint Cardmarket prices and PriceCharting PSA-10 history, measured point-in-time and survivorship-safe across June 2022–mid 2025.
Is this financial advice? No. It's research and education. Past tendencies do not guarantee future results.
See it on real cards, live
The pattern isn't just a table — it shows up on individual cards. TCGinvest charts every card with this lens, scores ~8,000 of them, and shows the working.
- ▸ See the top projected-ROI cards (with the why) →
- ▸ Check a card you own →
- ▸ Track a portfolio with real P&L →
(Rankings are transparent model output, not buy recommendations. We show the reasoning so you can judge it yourself — that's the entire point of this post.)
The takeaway
The biggest surprise wasn't that Pokémon prices are unpredictable.
It's that the market's emotional swings are remarkably consistent — and that the most natural instinct in the hobby, buying what's already hot, has been the one most reliably working against you.
All figures derived from verified English Near-Mint Cardmarket data and PriceCharting graded history, measured point-in-time and survivorship-safe. Research and education, not financial advice. Past tendencies do not guarantee future results. TCGinvest is not affiliated with Nintendo, The Pokémon Company, or any TCG publisher.