
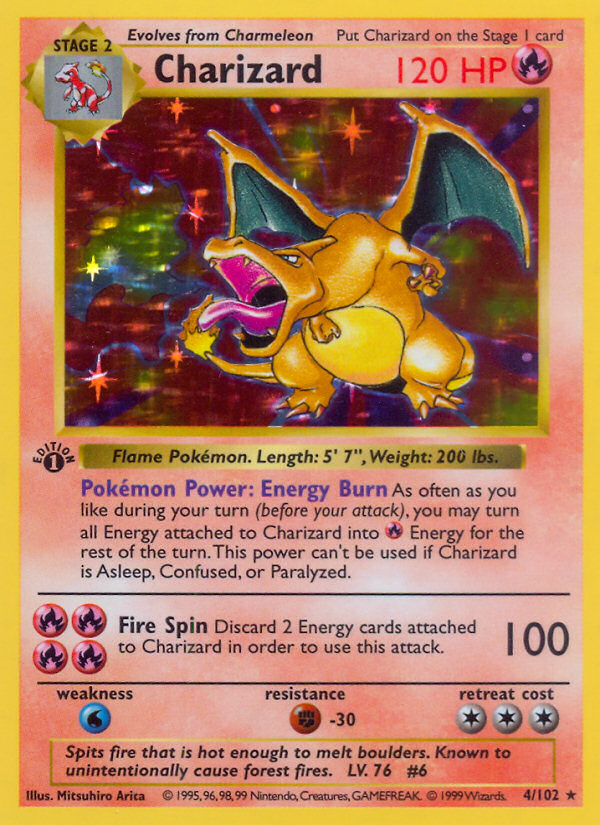
Base Set Charizard has been sent to PSA 99,447 times. It has come back a PSA 10 on 486 of them.
That is 0.5%, or one submission in 205.
The same Charizard artwork was reprinted in 2021 as part of Celebrations Charizard. That card has been submitted 57,500 times and returned 34,411 tens. That is 59.8%.
Same Pokémon, same picture, same grading company, same grade. One of them gems 120 times more often than the other.
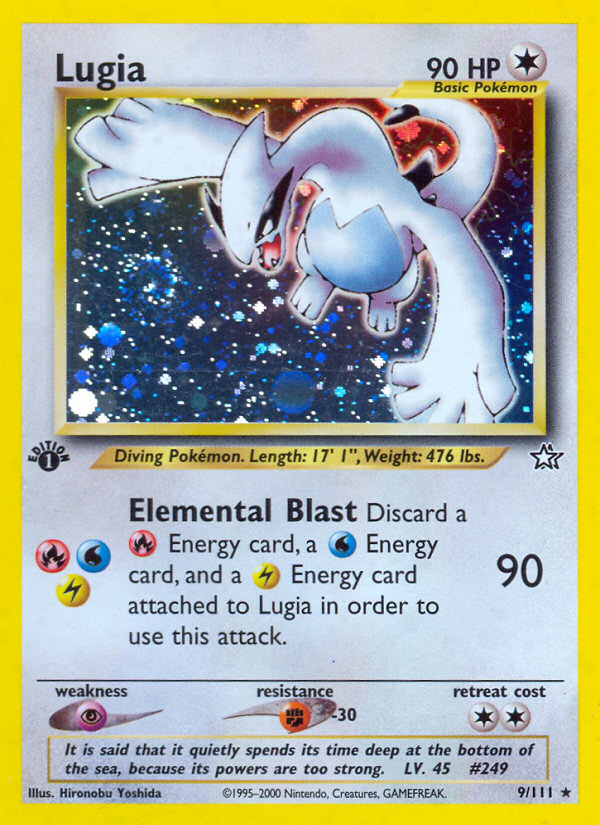
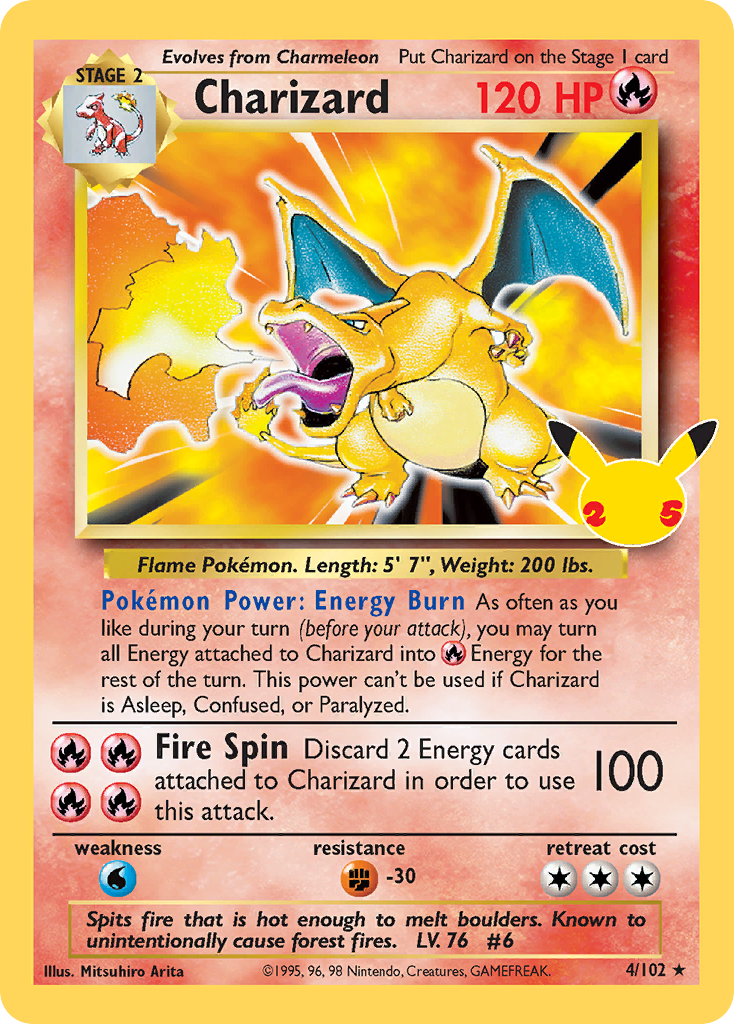
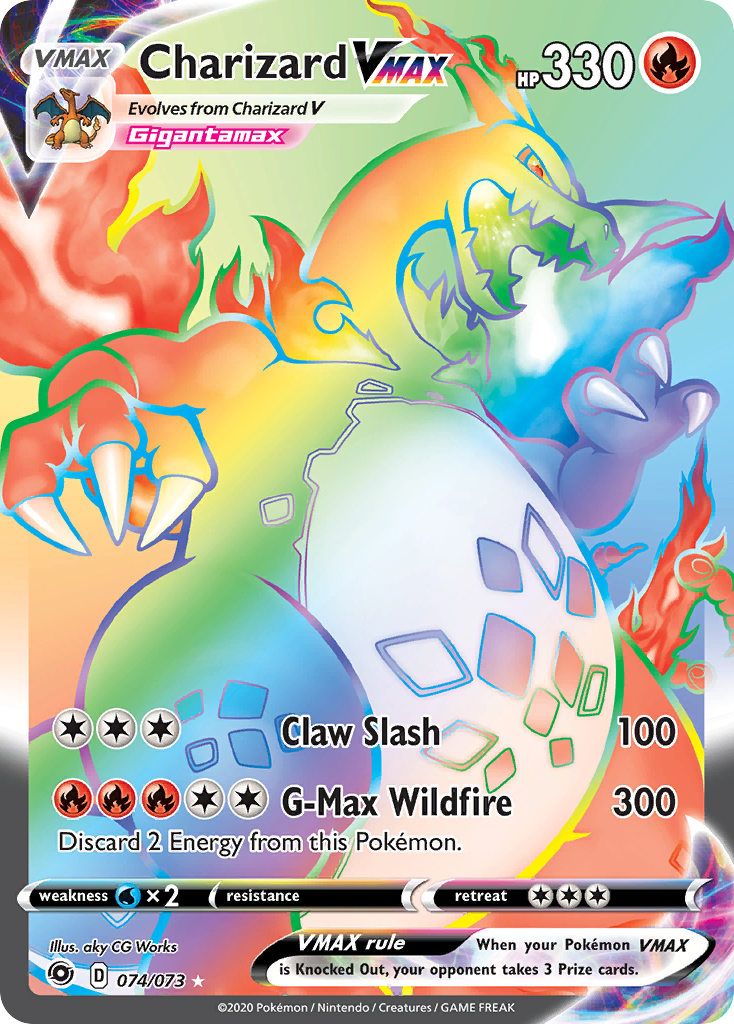
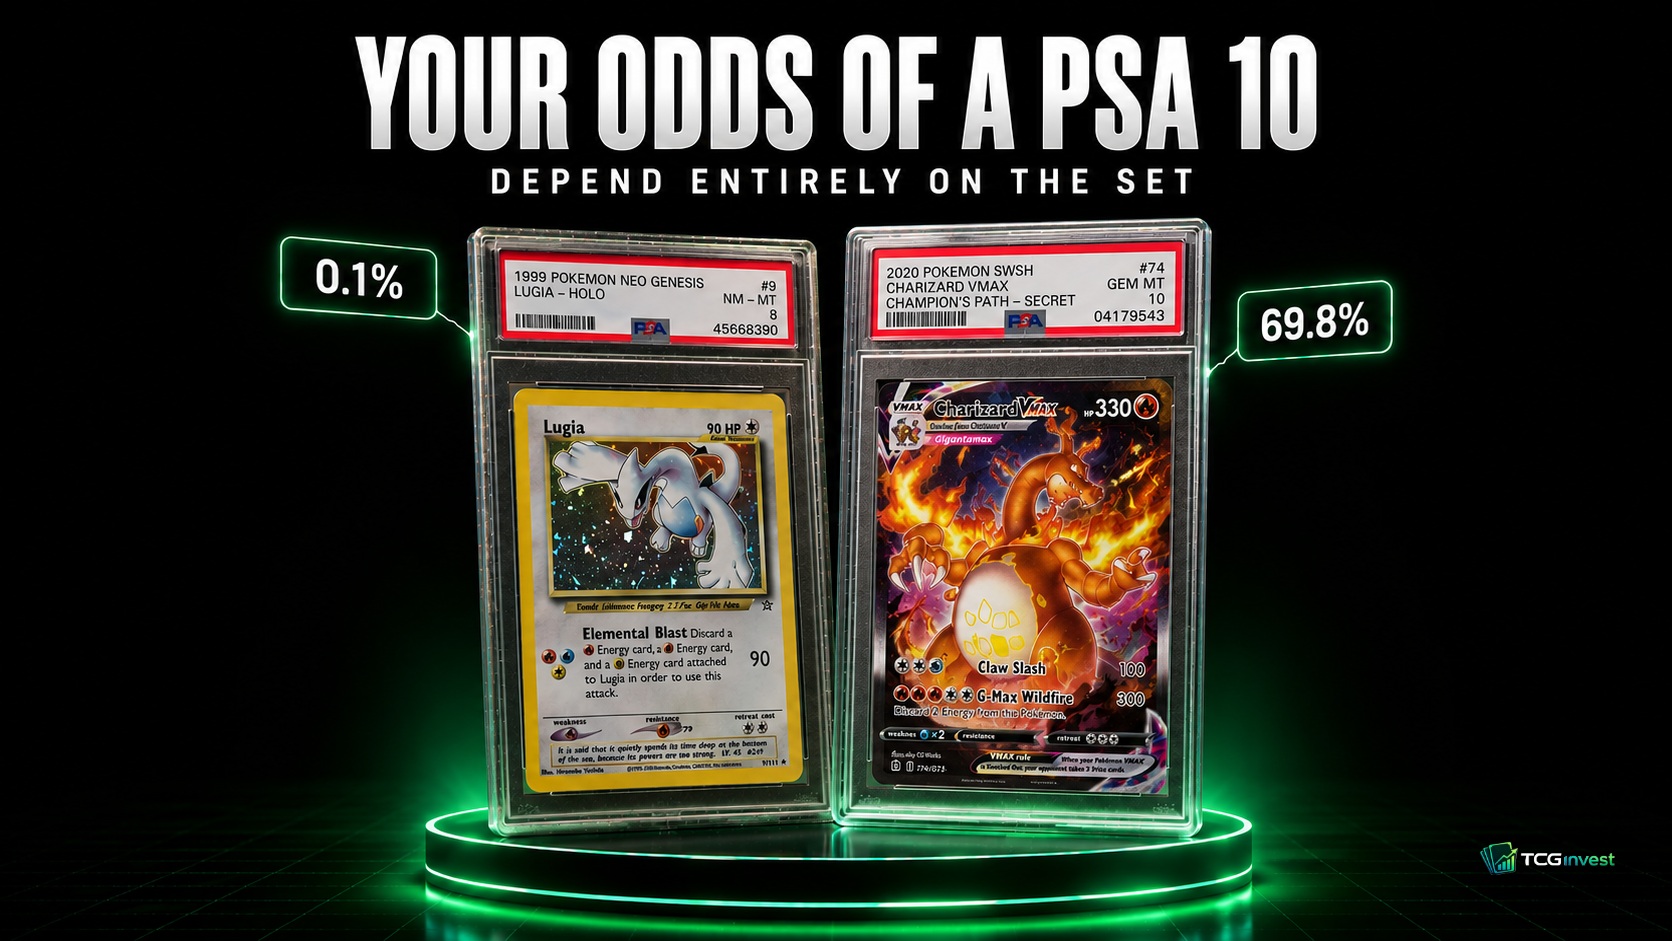
Two that almost never gem and two that usually do. Base Set Charizard 0.5%, Neo Genesis Lugia 0.1%, Celebrations Charizard 59.8%, Champion's Path Charizard VMAX 69.8%.
It is not a Charizard quirk. Blastoise and Venusaur do the same thing:
| Card | 1999 Base Set | 2021 Celebrations reprint |
|---|---|---|
| Charizard | 0.5% | 59.8% |
| Blastoise | 0.8% | 61.4% |
| Venusaur | 1.3% | 61.5% |
The average is the least useful number here
Across all 17,032 English cards we track, PSA has graded 12,192,926 submissions and awarded 3,912,941 tens. That works out at 32.1%.
That number gets quoted a lot and we do not think it is very useful, because it is the midpoint of two eras that behave nothing alike. Almost no card in the hobby actually sits near 32%.
These are conditional odds: the chance of a 10 given somebody already decided the card was worth grading. Nobody pays a grading fee on a creased card, so the population report never sees the bad copies.
That matters most for old cards. A 1999 holo that survived 27 years in a binder and still looked clean enough to submit was already an unusual card before it went in the envelope. The 0.5% is measured on cards that had passed a human filter first.
Submitter skill is inside the number too. Someone who checks centring, edges and surface under a light before paying will gem more often than someone mailing a stack in hope. The population report cannot separate the two.
We measure English-language cards only. Japanese print runs have their own centring and stock characteristics and are not in this data.
The odds by print year
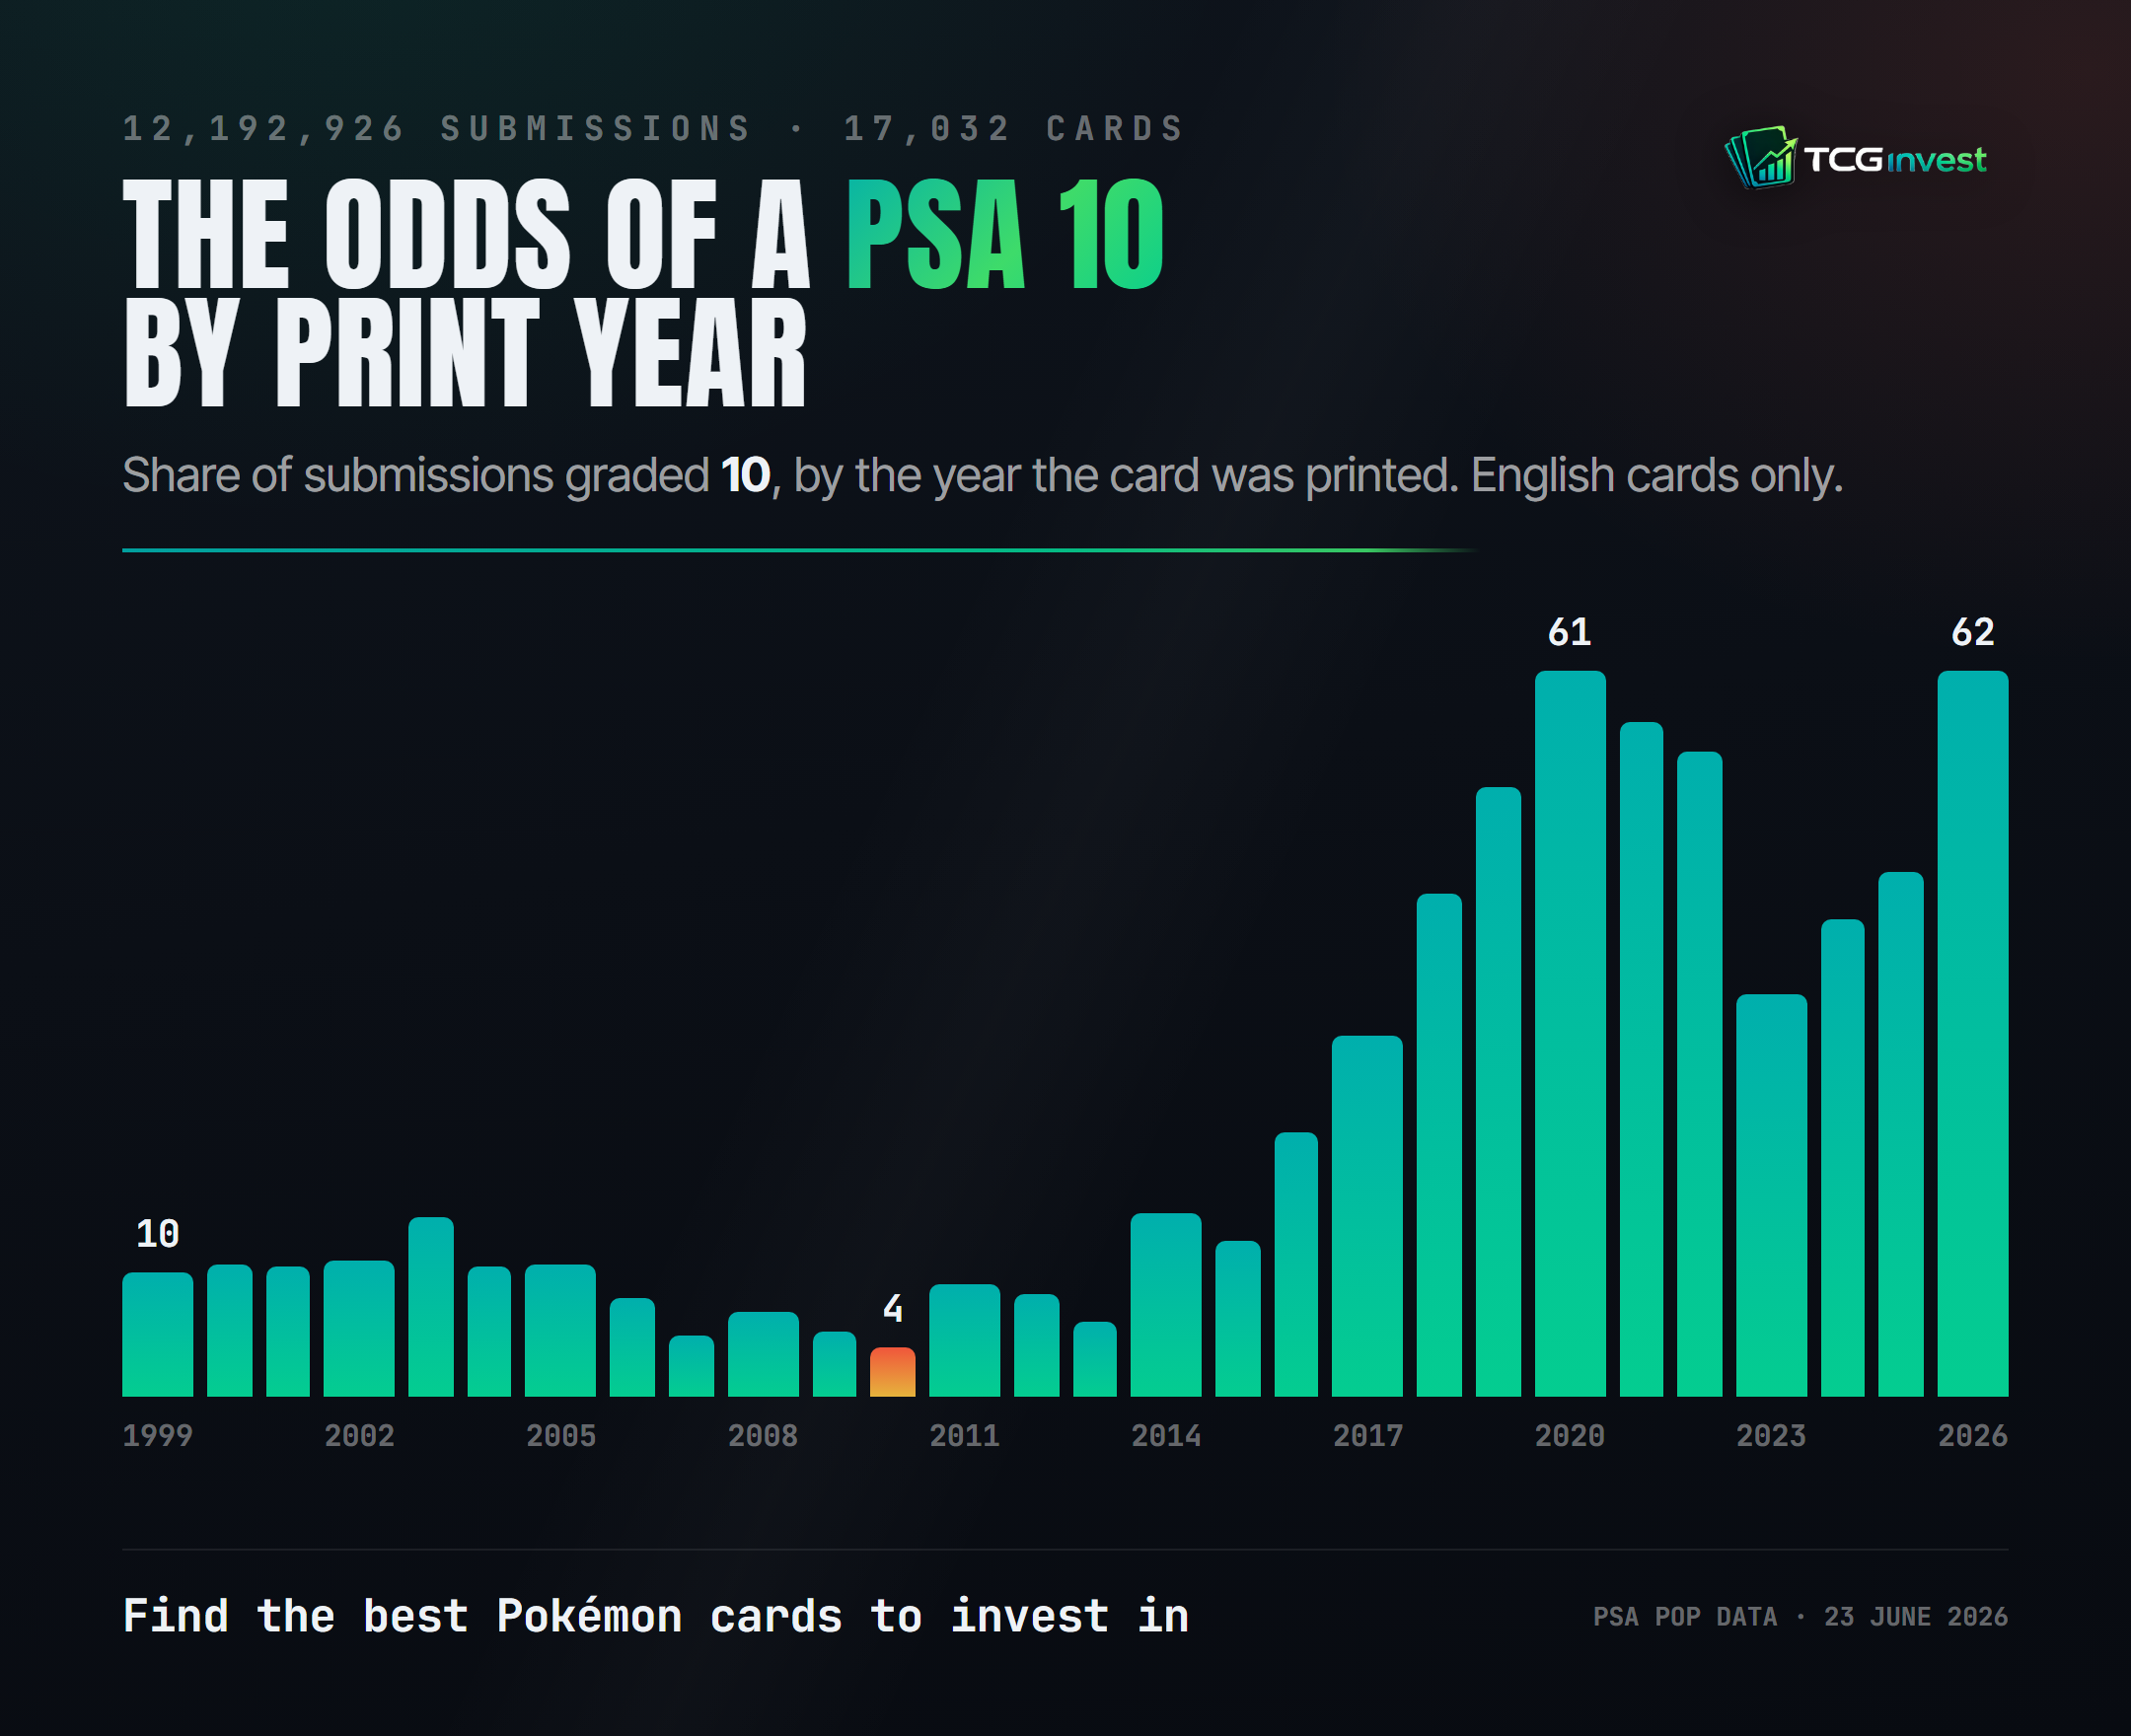
PSA 10 rate by the year the card was printed, across 12,192,926 submissions on 17,032 English cards. The floor is 2010 at 4.0%; the peak is 2020 at 61.1%.
| Print year | Submissions | PSA 10 rate |
|---|---|---|
| 1999 | 1,854,083 | 10.2% |
| 2003 | 197,435 | 14.7% |
| 2007 | 102,405 | 5.0% |
| 2010 | 19,256 | 4.0% |
| 2013 | 53,892 | 6.1% |
| 2016 | 591,662 | 21.7% |
| 2019 | 921,441 | 50.2% |
| 2020 | 541,068 | 61.1% |
| 2023 | 874,938 | 33.1% |
| 2026 | 64,626 | 62.1% |
Measured on PSA population data as of 23 June 2026.
The shape is not the one the hobby usually describes. "Old is hard, new is easy" is roughly right at the two ends and wrong in the middle. 2003 cards gem at 14.7%. Cards printed seven years later gem at 4.0%. The hardest stretch to gem is not the 1990s, it is the run from about 2006 to 2013.
Two things plausibly sit behind that. The foil stock and border treatment used across the Diamond and Pearl and HeartGold and SoulSilver years scratches and chips easily, and those cards were cheap for most of their life, so they were played with and stored casually rather than protected. Cards from 1999 that were treated the same way mostly did not survive to be submitted at all.
Set by set, the range is 115x
| Hardest to gem | Year | Submissions | PSA 10 rate |
|---|---|---|---|
| Double Crisis | 2015 | 11,439 | 0.6% |
| DP Black Star Promos | 2007 | 18,810 | 1.1% |
| Neo Genesis | 2000 | 58,623 | 3.3% |
| Secret Wonders | 2007 | 16,842 | 3.4% |
| Arceus | 2009 | 15,479 | 3.9% |
| HeartGold & SoulSilver | 2010 | 19,256 | 4.0% |
| Easiest to gem | Year | Submissions | PSA 10 rate |
|---|---|---|---|
| Darkness Ablaze | 2020 | 101,834 | 68.7% |
| Champion's Path | 2020 | 107,739 | 65.6% |
| Sword & Shield | 2020 | 61,266 | 64.9% |
| Silver Tempest Trainer Gallery | 2022 | 87,617 | 63.3% |
| Celebrations: Classic Collection | 2021 | 391,780 | 61.8% |
| Evolving Skies | 2021 | 338,699 | 59.4% |
Sets with at least 10,000 submissions. Double Crisis returns a 10 on roughly one submission in 167. Darkness Ablaze returns one on better than two in three.
Neo Genesis is the entry worth pausing on. 58,623 submissions is a large sample, not a fluke of a thin set, and it still only gems 3.3% of the time.
And the set average hides its own chase card. Neo Genesis Lugia has been submitted 11,559 times and returned 15 tens. That is 0.1%, or one in 771, and it is the harshest number in the whole dataset. A 2020 Champion's Path Charizard VMAX, on 29,239 submissions, returns one in 69.8% of the time. Those two cards sit 700 times apart on the same grading scale.
Some of this is just how the cards were made
Gem rate is not only about how a card was stored. It is partly decided at the printer, before anyone opens a pack.
Neo Genesis is the clearest case. The print run is known for left-heavy centring on its holos, and PSA's centring threshold is unforgiving: a border difference visible without a ruler is usually already outside what a 10 allows. On top of that the set uses the cosmos holo pattern, which shows fine scratches at certain angles under direct light, and a card can pick those up from its neighbours inside a sealed pack. A set can therefore arrive at the grader already carrying defects that no owner caused. 3.3% on 58,623 submissions is what that looks like in aggregate.
We looked for the same kind of documentation on the other low-gem sets and did not find anything that held up. HeartGold & SoulSilver is the awkward one: it is widely described as a high point for centring and holo application, and our data has it at 4.0%. Those two things do not fit together, and we would rather show the disagreement than pick whichever version reads better. It may be that the widely praised print quality applies to the era's reverse holos rather than the holo rares that dominate submissions, or that the set's cards were simply handled harder because they were cheap for a decade. We do not have evidence for either, so we are not going to assert one.
The honest position is that print run explains part of the spread, storage and handling explain part, and we can only demonstrate the first where somebody has documented it.
What the number is actually for
A grading fee is the same whether the card comes back a 10 or a 7. What changes is how often you clear it.
At 60% you are paying for a coin flip you win more often than not. At 4% you are paying 25 fees, on average, for one 10, and the other 24 cards come back in slabs that in many cases are worth less than the raw card was before you sent it. We looked at that side of it separately in our grading economics piece, where almost 4 in 5 cards lost money being graded.
The two numbers work together. The premium tells you what a 10 is worth. The gem rate tells you how many attempts it takes to get one. Neither is much use on its own.
Nothing here says a low gem rate is a reason not to grade. A Base Set Charizard in genuinely gem condition is worth the fee many times over precisely because only 486 of them exist in a PSA 10 after 99,447 attempts. That scarcity is the whole point. It just means the card in your binder is very probably not one of them, and the population report is the closest thing the hobby has to an honest prior.
PSA population data as of 23 June 2026, covering 17,032 English-language Pokémon cards and 12,192,926 graded submissions. Rates are grade-10 count divided by total graded, per card and per set. Population reports count only cards that were submitted, so all figures are conditional on someone choosing to grade; they are not the odds for a randomly chosen copy. Card and set metadata from our own catalogue. Nothing here is financial advice.